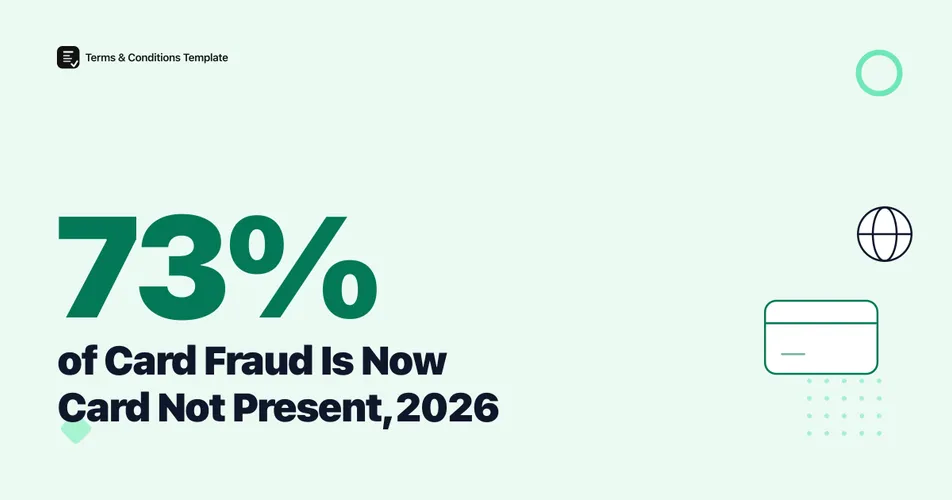
Card-not-present (CNP) fraud, purchases made without the physical card present, accounted for 73% of all US card payment fraud losses in 2023, up from 57% in 2019, according to eMarketer’s analysis of Federal Reserve and Commerce Department data. That share has grown every year ecommerce volume has grown, and the dollar totals behind it are climbing faster than card-present fraud. This article covers where CNP fraud losses are headed, how the fraud rate compares to in-person transactions, and what it actually costs a merchant once chargebacks and fraud tools are added in.
What share of card fraud happens with no card present?
A transaction counts as card-not-present whenever a shopper types in card details online, over the phone, or through an app, without ever inserting or tapping the physical card. That single distinction now drives most card fraud losses in the United States. CNP fraud accounted for 73% of all US card payment fraud losses in 2023, according to eMarketer’s analysis, up from 57% just four years earlier in 2019.
Figure 1: CNP fraud’s share of total US card payment fraud losses has climbed steadily as ecommerce volume has grown. Source: eMarketer analysis of Federal Reserve and US Department of Commerce data (2019, 2023); a separate 2024 estimate from Clearlypayments, citing Nilson Report data, uses a different methodology and should be read as directional, not a like-for-like comparison.
Info
The 2024 figure above (71%) comes from a different source and methodology than the 2019 and 2023 figures (eMarketer). Both point to the same conclusion, CNP fraud is now the large majority of card fraud, but the exact year-over-year change between 2023 and 2024 should not be read as a precise trend line across two different studies.
The direction is not in dispute even where the exact percentage varies by source. As card-present fraud has been squeezed out by chip cards and tap-to-pay, fraud has migrated to the channel where a physical card was never required in the first place.
How much money is lost to CNP fraud, and where is it heading?
US CNP fraud losses reached $9.49 billion in 2023, up 8.5% from 2022, according to eMarketer. A separate analysis by Clearlypayments, drawing on Nilson Report data, put 2024 US CNP fraud losses at roughly $10 billion, up from $9.5 billion the year before, and found CNP fraud made up 71% of all US card fraud losses that year. The same Nilson-based analysis noted the US accounts for about 25% of global card transactions but 42% of global card fraud losses, a concentration driven largely by its CNP exposure.
Zoom out to the global picture and the number gets considerably larger. Visa’s 2025 Global eCommerce Payments & Fraud Report projects worldwide CNP fraud losses will reach $43.6 billion by 2027.
Ecommerce growth is the underlying driver behind both the US and global figures. Every new payment channel that skips a physical card swipe, from browser checkout to in-app purchases to phone orders, adds volume to the CNP side of the ledger without adding any of the friction that limits card-present fraud.
How much higher is the CNP fraud rate than in-person fraud?
CNP fraud rates run 7.5 times higher than card-present fraud rates, according to Visa’s 2025 Global eCommerce Payments & Fraud Report, based on VisaNet transaction data collected between April 2023 and March 2025. Over that same two-year window, Visa’s own data shows card-present fraud rates fell by roughly 85%, a sign of how effective chip cards and contactless authentication have become at the point of sale.
Figure 2: Visa’s own network data shows a CNP transaction is far more likely to be fraudulent than a card-present one. Source: Visa, 2025 Global eCommerce Payments & Fraud Report, VisaNet data, April 2023 to March 2025.
That gap is exactly why card networks and issuers keep layering additional authentication onto online checkout. A transaction that never involves a physical card has fewer built-in signals to confirm the person paying is the person who owns the card, so the industry has built a stack of software checks to compensate.
Figure 3: The authentication checks a typical CNP transaction passes through before approval. Source: synthesized from standard AVS, CVV, and 3D Secure processing flows described in Visa and Merchant Risk Council merchant guidance.
A merchant who skips these checks to reduce friction at checkout is trading a lower decline rate today for a higher share of that 7.5x fraud exposure tomorrow.
How has the CNP fraud rate moved over time?
Basis-point data tells the same story with more precision than a simple percentage. The average CNP fraud rate on US debit cards rose from 26.1 basis points in 2019 to 41.6 basis points in 2023, a 59% increase in four years, according to the Federal Reserve Bank of Kansas City’s payments research group, citing issuer-reported data from Pulse’s annual debit issuer study (the underlying issuer sample size is not disclosed in the Federal Reserve’s public summary).
Figure 4: US debit card CNP fraud rates, measured in basis points, nearly doubled between 2019 and 2023. Source: Pulse debit issuer study, cited in Federal Reserve Bank of Kansas City payments research.
A basis point equals one-hundredth of one percent, so a 41.6 basis-point rate means roughly 42 cents is lost to CNP fraud for every $1,000 in debit card volume processed, the highest rate Pulse has recorded in this series.
Figure 5: Key CNP fraud milestones from 2019 through the 2027 forecast. Sources: eMarketer, Visa 2025 Global eCommerce Payments & Fraud Report, Federal Reserve Bank of Kansas City, LexisNexis Risk Solutions.
What does CNP fraud actually cost merchants, beyond the loss itself?
The dollar figure lost directly to fraud is only part of the bill. US ecommerce and retail merchants now lose $5.13 for every $1 of direct fraud loss, the first time LexisNexis’s Fraud Multiplier has crossed $5 in its US market, according to the 2026 True Cost of Fraud study (ecommerce and retail edition, June 2026, n=513 risk and fraud leaders across the US and Canada). That multiplier has more than doubled from roughly $2.40 per $1 lost in 2016. The same study found up to 83% of fraud costs for ecommerce merchants occur in online and mobile channels, which is where CNP transactions live, and 37% of retail and ecommerce organizations reported significant revenue losses tied to fraud over the past year.
A meaningful part of that multiplier shows up as chargebacks once a fraudulent CNP transaction is disputed. Our chargeback statistics post covers the industry-wide dispute picture in full, but the CNP-specific slice is worth isolating here: card-not-present ecommerce chargeback rates typically run between 0.6% and 1.0%, well above the 0.12% rate seen on card-present restaurant transactions, based on processor benchmark data aggregated by Chargebacks911. Each of those disputes then carries its own fee stack, which our chargeback fee statistics post breaks down separately.
A clear, easy-to-find refund policy generator will not stop a stolen-card CNP transaction from being attempted, but it does reduce the confused-charge disputes that inflate a merchant’s overall chargeback ratio, the same ratio that determines whether a business gets pulled into a card network’s monitoring program on top of its existing fraud losses.
CNP fraud at a glance
| Metric | Value | Source |
|---|---|---|
| CNP share of US card fraud losses, 2023 | 73% (up from 57% in 2019) | eMarketer |
| US CNP fraud losses, 2023 | $9.49 billion | eMarketer |
| US CNP fraud losses, 2024 (est.) | ~$10 billion | Clearlypayments / Nilson Report |
| CNP fraud rate vs. card-present | 7.5x higher | Visa, 2025 |
| Global CNP fraud losses, 2027 (forecast) | $43.6 billion | Visa, 2025 |
The Bottom Line
The single number that matters most for 2026 planning is 73%: card-not-present transactions now generate roughly three out of every four dollars lost to card fraud in the United States, and every data source in this article, whether it lands at 71% or 73%, agrees on the direction. Card-present fraud has been driven down by chip cards and contactless payments; CNP fraud has grown right alongside ecommerce. A merchant’s realistic response is not to eliminate CNP fraud entirely, no single checkout flow does that, but to keep the downstream costs in check: strong AVS and CVV checks, a 3D Secure step where it makes sense, and a clear, fast refund and dispute process that keeps confused customers from turning into chargebacks on top of an already fraud-heavy channel.
Frequently Asked Questions
What percentage of card fraud is card-not-present? CNP fraud made up 73% of all US card payment fraud losses in 2023, up from 57% in 2019, according to eMarketer’s analysis of Federal Reserve and US Department of Commerce data. A separate 2024 estimate, using different methodology, put the figure at 71%.
How much money is lost to card-not-present fraud each year? US CNP fraud losses reached $9.49 billion in 2023, up 8.5% from 2022, and an estimated $10 billion in 2024, according to eMarketer and a Clearlypayments analysis of Nilson Report data. Visa projects global CNP fraud losses will reach $43.6 billion by 2027.
How much higher is the CNP fraud rate than in-person card fraud? CNP fraud rates run 7.5 times higher than card-present fraud rates, according to Visa’s 2025 Global eCommerce Payments & Fraud Report, drawn from VisaNet data between April 2023 and March 2025. Card-present fraud rates fell roughly 85% over that same window.
What does CNP fraud cost merchants beyond the direct loss? US ecommerce and retail merchants now lose $5.13 for every $1 of direct fraud loss, the first time LexisNexis’s Fraud Multiplier has crossed $5, according to its 2026 True Cost of Fraud study (n=513 risk and fraud leaders). Up to 83% of those fraud costs land in online and mobile channels.
Sources and References
- eMarketer. “Card-Not-Present Fraud to Make Up 73% of Card Payment Fraud.” Analysis of US Department of Commerce and Federal Reserve data, 2019 and 2023 figures.
- Visa. (2025). “Global eCommerce Payments & Fraud Report.” VisaNet data, April 2023 to March 2025.
- Federal Reserve Bank of Kansas City. “New Data on Card-Present and Card-Not-Present Fraud Rates in the United States.” Payments System Research Briefing, citing Pulse’s debit issuer study.
- LexisNexis Risk Solutions. (2026). “True Cost of Fraud Study: Ecommerce and Retail Edition.” Survey of 513 risk and fraud leaders, US and Canada.
- Clearlypayments. “Credit Card Fraud Statistics in 2024 for USA.” Aggregates Nilson Report data on US card fraud share and losses.
- Nilson Report. “Card Fraud Losses Worldwide, 2024.” Global card purchase volume and fraud loss tracking.
- Chargebacks911. “Chargeback Stats: All the Key Dispute Data Points.” Processor benchmark data by industry, including card-not-present ecommerce chargeback rates.
Note: All figures verified as of October 2026. CNP fraud rates and dollar totals are revised as new annual data is published by each source, so headline figures are refreshed at least twice a year.