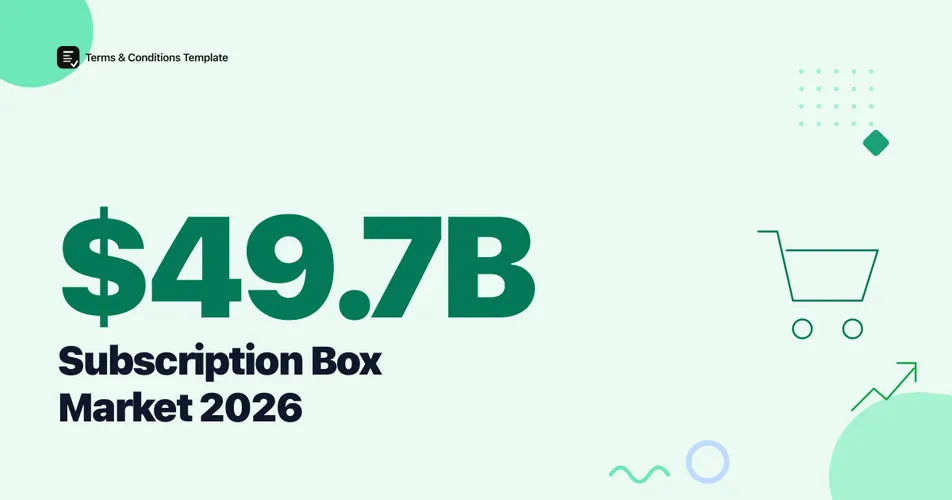
The global subscription box market will reach $49.7 billion in 2026, up from $41.47 billion in 2025, according to Research and Markets’ 2026 Subscription Box Market Report. That growth is uneven: food and beverage boxes still lead on revenue, beauty subscriptions are growing faster than any other category, and monthly churn remains the industry’s toughest problem to solve.
This roundup pulls together the clearest 2026 data on subscription box market size, category mix, subscriber retention, and average spend, and flags exactly where the widely repeated numbers get shaky.
How big is the subscription box market in 2026?
The subscription box market is valued at $49.7 billion in 2026, up from $41.47 billion in 2025, according to Research and Markets. The firm’s forecast puts the market at $101.81 billion by 2030, holding a 19.6% CAGR over that stretch. Application categories tracked in the report span health and fitness, food and beverages, apparel, personal care and cosmetics, books, and education.
Figure 1: Global subscription box market size, actual and forecast. Source: Research and Markets, 2026 Subscription Box Market Report.
For how subscription boxes fit into the wider recurring-revenue picture, see our subscription economy statistics for 2026, which covers the broader subscription market that includes streaming, software, and box commerce combined.
Why do subscription box market size estimates vary so much?
Ask three research firms how big the subscription box market is and you get three different answers, because each one draws its own line around what counts as a “subscription box” and how far out it forecasts.
| Research firm | Latest disclosed figure | Longer-term forecast | CAGR |
|---|---|---|---|
| Research and Markets | $49.7B (2026) | $101.81B by 2030 | 19.6% (2026-2030) |
| IMARC Group | $42.5B (2025) | $124.1B by 2034 | 12.64% (2026-2034) |
| Global Market Insights | $31.9B (2026) | $79.7B by 2035 | 10.7% (2026-2035) |
None of these figures is wrong on its own terms, but they are not directly comparable: they cover different base years, different forecast horizons, and different definitions of which recurring product categories count as a subscription box versus general e-commerce subscription. Treat any single headline number as one firm’s estimate, not a settled industry total.
Which subscription box category leads on revenue?
Food and beverage boxes hold the largest share of the market, accounting for 35.4% of global subscription box revenue in 2025, according to Global Market Insights. Replenishment-model boxes, which resupply a product the subscriber already uses rather than curate something new, made up an estimated $12.8 billion of the roughly $27.7 billion in 2025 revenue that Global Market Insights tracks under its own market scope, the largest single subscription type in that report.
Figure 2: Food and beverage share of global subscription box revenue. Source: Global Market Insights, 2025 data.
Convenience and recurring necessity explain why food leads: a meal-kit or coffee box replaces a shopping trip a household was already going to make, while curated boxes in categories like beauty or apparel have to convince a subscriber to keep paying for discovery rather than a staple.
Which subscription box category is growing fastest?
Beauty is the outlier on growth. The global beauty subscription box market is forecast to reach $10.72 billion by 2030, expanding at a 24.7% CAGR from 2024 to 2030, according to Grand View Research. The US beauty subscription box market alone is projected to hit $3.97 billion by 2030 at a 21.6% CAGR from 2025, faster than the subscription box category’s overall growth rate.
Figure 3: Forecast CAGR, beauty subscription boxes versus the overall subscription box market. Source: Grand View Research (beauty, 2024-2030); Research and Markets (overall market, 2026-2030).
That growth gap matters for anyone running a beauty box: faster category growth also means more competitors entering the same space, which raises the stakes on clear cancellation and refund terms as a differentiator, not just paperwork.
How much do subscription box customers spend each month?
Subscription box buyers spent a monthly total of around $58 across an average of two active boxes, according to CouponFollow’s survey of 1,007 US subscription box consumers. Spending varies widely by category: food and meal-kit boxes averaged about $74 a month, clothing and fashion boxes averaged $64 a month, and technology boxes averaged $46 a month.
Warning
CouponFollow’s category spend figures are the most detailed, disclosed-sample-size breakdown by category we could trace, but the underlying survey dates to 2020 and was last refreshed in 2022. We could not find a fresher, comparably rigorous replication as of this writing, so treat these per-category dollar amounts as directional for 2026 rather than a current measurement.
Cratejoy, the largest subscription box marketplace platform, recommends new sellers price between $35 and $50 a month to leave room for a 40-50% gross margin after product and shipping costs, a range that lines up closely with what CouponFollow’s respondents reported actually paying.
How many subscribers cancel, and how fast?
Cancellation is the norm, not the exception, in subscription box commerce. Nearly 40% of e-commerce subscribers have canceled at least one subscription, and more than a third of subscribers who sign up cancel within the first three months, with over half gone by six months, according to McKinsey’s survey of 5,093 US consumers fielded in November 2017. Meal-kit boxes showed the steepest early drop-off, with 60% or more of subscribers canceling within six months in that same study.
Figure 4: How subscription box cancellations concentrate in the first six months. Source: McKinsey, “Thinking Inside the Subscription Box,” November 2017 survey, n=5,093.
More current, disclosed-methodology data points to a similar retention challenge. Subbly’s Churn Data Report found a median monthly churn rate of 7.44% across thousands of active merchants on its platform in the September to November 2024 period, and Recurly separately reports a 4.25% median annual churn rate for its ecommerce and subscription-box merchant segment as of July 2026. The two figures measure different things, monthly versus annual churn on different merchant networks, so they should not be averaged together, but both point the same direction: subscription boxes lose subscribers faster than software or media subscriptions.
McKinsey’s data also found what reduces churn: replenishment subscribers who can skip an order stay 135% longer, and those who can swap a product stay 71% longer, than subscribers on a rigid ship-every-month plan. A clear, easy-to-find Refund Policy Generator that spells out how skips, swaps, and cancellations work reduces the support tickets and chargebacks that come from subscribers who feel trapped in a box they no longer want.
How has the subscription box market grown over time?
The category’s growth has been extreme by retail standards. US subscription box sales grew from $57.0 million in 2011 to $2.6 billion in 2016, more than doubling every year over that stretch, according to McKinsey’s research. That early boom set up the market research firms now tracking a multi-billion-dollar global category.
Figure 5: Subscription box market growth, historical and forecast. Sources: McKinsey (2011, 2016); Research and Markets (2025, 2026, 2030 forecast).
For a look at how a closely related recurring-revenue category is performing on price sensitivity and churn, see our streaming subscription statistics for 2026.
Subscription box data at a glance
| Metric | 2026 value | Source |
|---|---|---|
| Global market size | $49.7 billion | Research and Markets |
| Food and beverage share of revenue | 35.4% | Global Market Insights, 2025 data |
| Beauty subscription box CAGR | 24.7% (2024-2030) | Grand View Research |
| Median monthly merchant churn | 7.44% | Subbly, 2024 data |
| Average monthly spend, active subscribers | $58 across 2 boxes | CouponFollow survey, n=1,007 |
| Subscribers who cancel within 3 months | More than one-third | McKinsey, 2017 survey |
The Bottom Line
The subscription box market’s growth to $49.7 billion in 2026 hides a category that is still churning subscribers about as fast as it acquires them. Food and beverage boxes hold the revenue lead on convenience alone, beauty is growing fastest because it is starting from a smaller base with room to run, and nearly 40% of subscribers have walked away from a box subscription at some point. The businesses that beat that churn rate are not the ones with the flashiest unboxing experience, they are the ones that make skipping, swapping, and canceling easy and clearly explained before a subscriber ever has to go looking for a way out. A current, plain-language refund and cancellation policy is one of the cheapest ways to turn a subscriber thinking about quitting into one who pauses instead.
Frequently Asked Questions
How big is the subscription box market in 2026? The global subscription box market is projected to reach $49.7 billion in 2026, up from $41.47 billion in 2025, according to Research and Markets’ 2026 Subscription Box Market Report.
What is the most popular subscription box category? Food and beverage boxes hold the largest share of global subscription box revenue at 35.4% in 2025, per Global Market Insights. Beauty subscription boxes are the fastest-growing category, forecast at a 24.7% CAGR through 2030 according to Grand View Research.
What is a normal churn rate for a subscription box business? The median monthly churn rate across subscription box merchants was 7.44% in late 2024, according to Subbly’s analysis of thousands of active merchants on its platform.
How much do people spend on subscription boxes each month? Subscription box buyers spent a monthly total of around $58 across an average of two active boxes, and food or meal-kit boxes averaged about $74 a month, per CouponFollow’s survey of 1,007 US subscription box consumers.
Sources and References
- Research and Markets. (2026). “Subscription Box Market Report.” Global market size and forecast to 2030.
- Global Market Insights. (2026). “Subscription Box Market Size, Share, Forecast.” Category and market-type breakdown, 2025 data.
- IMARC Group. (2025). “Subscription Box Market Size, Trends, Growth.” Global market forecast to 2034.
- Grand View Research. (2024). “Beauty Subscription Box Market Size & Share Report.” Global forecast to 2030.
- Subbly. (2024). “The Churn Data Report.” Analysis of thousands of active Subbly merchants, September-November 2024 data.
- Recurly. (2026). “Churn Rate Benchmarks.” Ecommerce and subscription-box merchant segment, July 2026 data.
- McKinsey & Company. (2018). “Thinking Inside the Subscription Box: New Research on E-Commerce Consumers.” Survey of 5,093 US consumers, fielded November 2017.
- CouponFollow. (2022 update). “Are Subscription Boxes Worth It?” Survey of 1,007 US subscription box consumers, fielded 2020.
Note: All figures verified as of October 2026. Subscription box market size, category, and churn figures are refreshed at least twice a year. The McKinsey and CouponFollow consumer figures are the freshest disclosed-methodology data we could trace as of this writing but date to 2017-2022 surveys; treat them as directional.