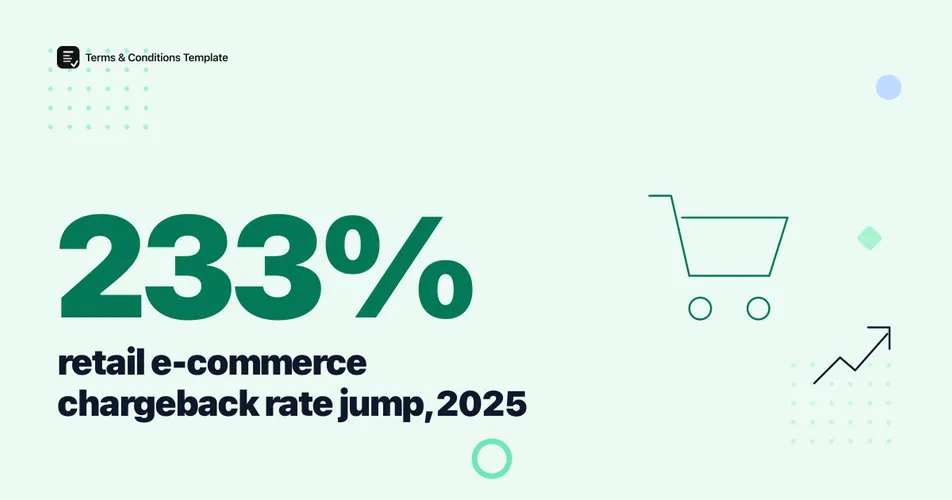
Retail e-commerce chargeback rates rose 233% year over year in 2025, the steepest increase of any merchant category, according to Sift’s Q4 2025 Digital Trust Index. Transportation followed close behind at 226%, while B2C and B2B software and services categories rose a comparatively modest 83% and 77%. A merchant benchmarking against an all-category average of 0.26% is likely benchmarking against the wrong number once a specific industry is this far from the middle.
Which industries saw chargeback rates rise fastest in 2025?
Retail e-commerce and transportation pulled far ahead of every other category Sift tracked in 2025. Retail e-commerce disputes rose 233% year over year, and transportation rose 226%, more than double the next tier of categories: B2C SaaS and services at 83%, B2B SaaS and services at 77%, online travel agencies at 51%, commerce marketplaces at 45%, and ticketing and reservations at 29%.
Figure 1: Retail e-commerce and transportation chargeback rates rose far faster than any other category Sift tracked in 2025. Source: Sift, Q4 2025 Digital Trust Index.
Sift does not publish the absolute transaction volume behind these figures for this specific report, describing its Digital Trust Index only as drawing on a global network processing more than one trillion annual events across its platform. Treat the percentages as directionally reliable and disclosed by a named source, without a stated per-report sample size.
That gap between categories matters more than the all-category average. A merchant selling in retail e-commerce whose dispute rate tracked the 0.26% blended figure in early 2025 was likely running well behind the category’s real trajectory by year end, while a B2B SaaS company riding a 77% increase started from a much smaller base.
Why do so many “chargeback rate by industry” tables show the same numbers?
A large share of the per-industry chargeback rate tables circulating online, the kind that list restaurants at roughly 0.1% and online education at close to 5%, trace back to a single source: a Chargebacks911 benchmark graphic. Chargebacks911’s own chargeback-rate page states plainly that those per-industry figures “were compiled before the Covid-19 outbreak,” meaning the underlying data predates the biggest shift in ecommerce category mix in a generation.
Warning
Multiple sites currently present per-industry chargeback rate tables (commonly citing figures like 0.12% for card-present restaurants up to roughly 4.79% for online education and info products) as 2025 or 2026 benchmark data. These numbers trace back to the pre-pandemic Chargebacks911 graphic described above, aggregated and re-aggregated by SEO content sites without a fresh measurement or a disclosed methodology of their own. Treat any specific per-industry rate percentage sourced this way as an old estimate, not a current one, until a named source discloses a fresh methodology and date.
Figure 2: A quick test for whether a chargeback rate by industry figure you find online is safe to use as a current benchmark. Source: synthesized from Chargebacks911’s own disclosed data-vintage caveat, above.
This does not mean per-industry chargeback rates do not vary; they do. It means the specific decimal-point percentages still being reposted as “2025-2026 data” across dozens of payment blogs are, in most cases, quietly recycling a graphic that predates the pandemic that reshaped online retail.
The one general rule of thumb that has held up across current processor commentary is broader: card-not-present ecommerce overall runs a chargeback rate of roughly 0.6% to 1.0%, well above the 0.26% blended average Sift measured across all categories in Q3 2025, and above card-present retail, which typically runs closer to 0.1%.
How does chargeback dollar value differ by industry?
Rate is only half the cost picture. Within the categories Sift measured for dispute value specifically, B2B software and services saw the fastest growth from Q1 to Q3 2025, up 50%, ahead of payments at 29%, travel and reservations at 17%, and restaurant ordering at 14%. Separately, the average dispute value across all categories eased from $361.31 in Q1 2025 to $301.91 by Q3 2025, even as rates kept climbing, a sign that the growth is coming from more disputes rather than larger ones.
Figure 3: Chargeback dollar value grew fastest for B2B software and services disputes even as the average dispute value overall declined. Source: Sift, Q4 2025 Digital Trust Index.
Info
A secondary summary of Mastercard and Datos Insights’ 2025 chargeback outlook, published by Chargeback Gurus, reports average chargeback value also varies sharply by industry: travel and hospitality reportedly averages $120 per dispute, high-risk categories like gambling and crypto $99, retail $84, digital goods $77, and subscription services $69. We could not independently verify this specific per-industry breakdown against Mastercard’s own report pages, which returned access errors when checked directly, so treat these five figures as secondary-sourced rather than independently confirmed, even though the report’s overall volume and value projections below match what Mastercard and Datos Insights have published elsewhere.
If that ranking holds, it lines up directionally with the rate data above: travel and transportation categories carry both faster-rising rates and (on the secondary figures) the highest average dollar cost per dispute, a combination that compounds quickly for merchants in those categories specifically.
Part of why rates vary this much by category traces back to what drives each dispute. The same secondary summary of Mastercard’s chargeback research breaks down how merchants themselves classify the causes behind their disputes: 38% non-fraud (a shopper simply changed their mind or did not recognize a charge), 25% third-party fraud, 21% first-party fraud, and 16% low-dollar write-offs merchants chose not to fight.
Figure 4: Merchants attribute a larger share of disputes to non-fraud confusion than to any single fraud category. Source: Chargeback Gurus’ secondary summary of Mastercard and Datos Insights’ 2025 chargeback research; not independently verified against Mastercard’s primary report.
An industry weighted toward recurring, easily-forgotten charges, like subscriptions or B2B software, skews toward that 38% non-fraud slice. An industry weighted toward high-ticket, shippable goods, like electronics or travel, skews toward the fraud slices instead. That is a plausible mechanism for why the rate-growth ranking above puts retail and transportation at the top.
How big is the chargeback problem getting overall?
Global chargeback volume is projected to climb from 261 million disputes in 2025 to 324 million by 2028, a 24% increase, according to Mastercard and Datos Insights’ 2025 chargeback outlook, with total value rising from $33.79 billion to $41.69 billion over the same period. Card-not-present transactions already make up 63% of merchant volume industry-wide, per Sift, which is the underlying reason dispute categories tied to online-only purchases (retail e-commerce, digital subscriptions, travel bookings) are absorbing most of the increase described above.
| Industry category | YoY chargeback rate change, 2025 | Data source |
|---|---|---|
| Retail e-commerce | +233% | Sift, Q4 2025 Digital Trust Index |
| Transportation | +226% | Sift, Q4 2025 Digital Trust Index |
| B2C SaaS and services | +83% | Sift, Q4 2025 Digital Trust Index |
| B2B SaaS and services | +77% | Sift, Q4 2025 Digital Trust Index |
Figure 5: The gap between when the still-circulating industry rate benchmark was compiled and when the current rate-growth data was measured. Sources: Chargebacks911 (data-vintage disclosure), Sift Q4 2025 Digital Trust Index.
A merchant sizing risk for 2026 gets a materially different picture depending on which of these two data sets they benchmark against, one describing where rates sat before 2020, the other describing how fast they are moving now.
For the two related pieces of this picture, our full chargeback statistics for 2026 covers total merchant costs and the friendly-fraud share of disputes, and first-party fraud data for 2026 breaks down who is filing disputes and why. A dedicated look at exactly what merchants pay in chargeback and monitoring fees by network tier is still being compiled for a future post in this series.
The Bottom Line
The industry-by-industry chargeback rate tables still circulating with “2025” or “2026” in the headline mostly recycle a Chargebacks911 graphic the company itself says predates the pandemic. The current data tells a narrower but more useful story: retail e-commerce and transportation chargeback rates rose 233% and 226% respectively in 2025, far outpacing every other category Sift tracked, while B2B software and services disputes grew fastest in dollar value even as the overall average dispute shrank. A merchant in a fast-rising category who publishes a clear, plain-language refund policy generator with an obvious return window and dispute contact path is addressing exactly the kind of confused-charge dispute that drives a meaningful share of this growth, in the categories where it is currently rising fastest, not the ones an outdated benchmark graphic would point to.
Frequently Asked Questions
What is the average chargeback rate by industry in 2026? There is no single reliable, current answer for every industry. Card-not-present ecommerce overall commonly runs a 0.6% to 1.0% chargeback rate, per processor benchmarks, but the rate at which disputes are rising varies enormously by category. Retail e-commerce rose 233% year over year in 2025, the fastest of any industry, and transportation rose 226%, according to Sift’s Q4 2025 Digital Trust Index.
Which industry has the highest chargeback rate? Retail e-commerce and transportation saw the fastest-rising chargeback rates in 2025, up 233% and 226% year over year respectively, per Sift’s Q4 2025 Digital Trust Index. By dispute dollar value, travel and hospitality reportedly averages the most at $120 per chargeback, though that specific industry breakdown could only be sourced through a secondary summary of Mastercard and Datos Insights’ report, not verified against the primary document directly.
Why do so many chargeback rate by industry tables show the same numbers? Most trace back to a single Chargebacks911 benchmark graphic. Chargebacks911’s own site states those per-industry figures “were compiled before the Covid-19 outbreak,” meaning pages presenting them as fresh 2025 or 2026 data are recycling a benchmark that is at least five years old.
How much does the average chargeback cost by industry? Sift measured an average chargeback value of $361.31 in Q1 2025, easing to $301.91 by Q3 2025. Within that, B2B software and services disputes saw the fastest value growth in 2025, up 50% from Q1 to Q3, ahead of payments (29%), travel and reservations (17%), and restaurant ordering (14%).
Sources and References
- Sift. (2025). “Q4 2025 Digital Trust Index: Dispute & Chargeback Data and Insights.” Industry rate and value growth figures, Q1-Q3 2025.
- Chargebacks911. “What Is a Chargeback Rate?” States its per-industry benchmark figures were compiled before the Covid-19 outbreak.
- Mastercard and Datos Insights. (2025). “2025 Global Chargebacks Outlook.” Global volume and value projections, 2025-2028.
- Chargeback Gurus. (2025). “Chargeback Stats and Insights From Mastercard’s State of Chargebacks Report.” Secondary summary of average chargeback value by industry; not independently verified against Mastercard’s primary report.
Note: All figures verified as of September 2026. Chargeback rates and industry benchmarks shift quarterly, so headline figures in this article are refreshed at least twice a year, and any secondary-sourced figures are re-checked against a primary source when one becomes available.