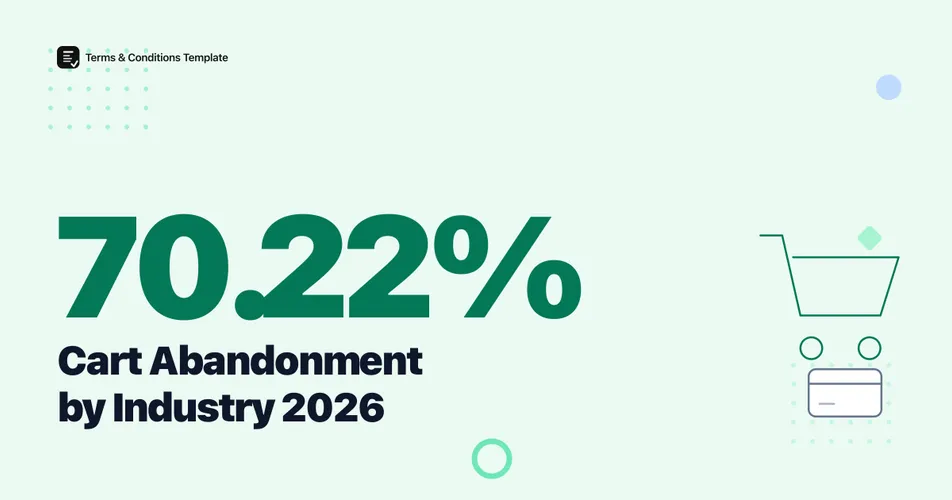
70.22% of online shopping carts are abandoned before the buyer completes checkout, according to Baymard Institute’s ongoing compilation of 50 individual studies conducted between 2006 and 2025. The figure has barely moved in over a decade, which means abandonment is not a bug in any one store’s checkout, it is the default outcome of online shopping itself. What separates a strong store from a weak one is how much of that 70% it recovers.
What is the average cart abandonment rate in 2026?
The average cart abandonment rate sits at 70.22%, according to Baymard Institute’s meta-analysis of 50 separately published studies spanning nearly two decades. The most recent entry in that compilation, an Uptain study published in 2025, measured 71.72%, close to the long-run average. Baymard’s underlying checkout research also draws on 25 rounds of qualitative usability testing across more than 4,400 recorded sessions and 54 rounds of benchmarking across 334 leading ecommerce sites.
That single number hides a wide range. Individual studies in the same compilation have reported rates as low as 55.00% (Forrester Research, 2010) and as high as 84.27% (SaleCycle, 2020), reflecting differences in how each vendor defines and measures “abandonment,” not a real swing in shopper behavior.
Figure 1: The spread of measured cart abandonment rates across Baymard Institute’s 50-study compilation, against the long-run average. Source: Baymard Institute, studies from 2006 to 2025.
The takeaway for a store owner is not to chase a single benchmark number. It is that seven in ten visitors who add something to a cart will leave without buying, in a fairly stable pattern regardless of year.
Why do shoppers abandon their carts?
The leading reason is cost, not indecision. 40% of shoppers who abandon a cart cite extra costs, shipping, tax, or fees revealed too late in the process, as their reason, according to Baymard Institute’s dedicated survey of checkout abandonment causes. Slow delivery estimates (20%) and distrust of the site with payment information (19%) round out the top three.
Return and account friction show up further down the list but are still large enough to matter for a refund policy specifically:
| Reason for abandonment | Share citing this reason |
|---|---|
| Extra costs too high (shipping, tax, fees) | 40% |
| Delivery was too slow | 20% |
| Didn’t trust the site with credit card information | 19% |
| Site wanted account creation | 18% |
| Checkout process too long or complicated | 17% |
| Website errors or crashes | 17% |
| Unsatisfactory returns policy | 13% |
| Couldn’t see or calculate total cost upfront | 12% |
Source: Baymard Institute, survey of checkout abandonment reasons.
Figure 2: The five most commonly cited reasons shoppers abandon a cart before completing checkout. Source: Baymard Institute checkout abandonment reasons survey.
None of the top reasons are about the product itself. Every one of them is a checkout or policy detail a store controls directly, which is exactly why fixing them moves the number.
How does the return policy affect abandonment?
An unclear or restrictive return policy pushes shoppers out of the cart before they ever place an order. 13% of shoppers name an unsatisfactory returns policy directly as a reason for abandoning a cart, per Baymard Institute. The effect is larger when policies get stricter: Blue Yonder’s 2024 Consumer Retail Returns Survey of more than 1,000 US consumers found that 69% of shoppers aware of tighter return policies say those policies deterred them from completing a purchase, up sharply from 59% in 2023. The same survey found 91% of respondents said a lenient return policy influences their decision to buy, and the effect was strongest among younger shoppers, with 76% of Gen Z and 74% of millennial respondents saying tighter policies held them back.
Figure 3: Year-over-year change in shoppers who say stricter return policies deterred a purchase. Source: Blue Yonder Consumer Retail Returns Survey, fielded July 2024, n=1,000+ US consumers.
A published, plain-language return policy removes this specific source of hesitation before it costs you a sale. Store owners can generate a refund policy that states the return window and conditions clearly enough to answer a shopper’s question before they abandon the cart to go search for it.
For the fuller picture of how return rates and policy design interact after the sale, see our ecommerce return rate statistics for 2026, which covers the 19.3% of orders that come back and what that costs retailers.
How does the abandonment rate vary by industry?
Abandonment is not uniform across categories. As of October 2024, per Dynamic Yield’s live industry benchmark dashboard, luxury and jewelry stores post the highest abandonment rate at 82.84%, while pet care and veterinary sites post the lowest at 54.78%, a nearly 30 percentage-point spread. Because this is a rolling, continuously updated benchmark rather than a fixed one-time study, treat the exact percentages as directional and expect them to shift slightly between snapshots.
| Industry | Cart abandonment rate |
|---|---|
| Luxury & jewelry | 82.84% |
| Beauty & personal care | 80.92% |
| Home & furniture | 80.32% |
| Fashion, accessories & apparel | 78.53% |
| Multi-brand retail | 76.90% |
| Food & beverage | 63.62% |
| Consumer goods | 57.37% |
| Pet care & veterinary services | 54.78% |
Source: Dynamic Yield industry benchmark dashboard, accessed October 2024. Overall cross-industry average in this dataset: 74.09%.
Figure 4: Cart abandonment rate by industry category, highest to lowest. Source: Dynamic Yield live benchmark dashboard, snapshot as of October 2024. Treat as directional; figures move between snapshots.
The pattern tracks purchase consideration time. Categories where a shopper compares options over days or weeks, like jewelry, furniture, and fashion, see far more carts started and abandoned than categories bought on a short replenishment cycle, like pet supplies or food and beverage.
Has the cart abandonment rate changed over time?
Not by much. Baymard’s 50-study compilation shows the measured average has stayed inside a roughly 68% to 72% band in every year since 2014, despite more than a decade of checkout redesigns, one-click payment options, and mobile-first commerce becoming standard.
Figure 5: Selected data points from Baymard Institute’s cart abandonment study compilation, showing the range and stability of measured rates. Source: Baymard Institute, 2006 to 2025.
Warning
Treat any single-year abandonment rate as one data point in a noisy series, not a trend. Individual studies swing more than 25 percentage points depending on methodology, traffic source, and device mix, even when the underlying shopper behavior has not meaningfully changed. The 70.22% figure is useful precisely because it averages that noise out across 50 studies rather than relying on one.
The stability itself is the finding. If abandonment has not structurally improved in over a decade of checkout investment, the remaining gains sit in policy clarity and cost transparency, not in interface polish alone.
The Bottom Line
70.22% of online shopping carts do not convert, and that number has held steady for over a decade regardless of how much stores have invested in checkout design. The reasons that move the needle are consistent across every study: surprise costs, slow delivery, payment distrust, and unclear return terms. Of those four, return policy clarity is the one a store can fix in an afternoon rather than a redesign cycle. A refund policy that states the return window, condition requirements, and refund method in plain language before checkout removes one of the specific frictions Baymard and Blue Yonder both measure, and it costs nothing to publish.
Frequently Asked Questions
What is the average cart abandonment rate? 70.22%, based on Baymard Institute’s compilation of 50 individual studies published between 2006 and 2025. The most recent entry, from Uptain in 2025, measured 71.72%.
Why do most shoppers abandon their cart? 40% cite extra costs at checkout, such as shipping, tax, or fees, as their top reason for abandoning a cart, according to Baymard Institute’s survey of checkout abandonment reasons. Slow delivery (20%) and distrust of the site with payment details (19%) follow.
Which industries have the highest cart abandonment rates? Luxury and jewelry stores see the highest abandonment at 82.84%, followed by beauty and personal care at 80.92% and home and furniture at 80.32%, per Dynamic Yield’s benchmark dashboard as of October 2024. Pet care and veterinary sites see the lowest at 54.78%.
Does an unclear return policy increase cart abandonment? Yes. 13% of shoppers cite an unsatisfactory returns policy as a reason for abandoning a cart, per Baymard Institute. Separately, 69% of consumers aware of stricter return policies say those policies deterred a purchase, up from 59% in 2023, according to Blue Yonder’s 2024 Consumer Retail Returns Survey of over 1,000 US consumers.
Sources and References
- Baymard Institute. (2025). “50 Cart Abandonment Rate Statistics.” Compilation of 50 studies, 2006 to 2025.
- Baymard Institute. Checkout usability research program, including 25 rounds of qualitative testing (4,400+ sessions) and 54 rounds of benchmarking across 334 sites.
- Blue Yonder. (2024). “Consumer Retail Returns Survey.” Fielded July 12, 2024, n=1,000+ US consumers.
- Oberlo, citing Dynamic Yield. “Cart Abandonment Rate by Industry.” Live benchmark dashboard, snapshot accessed October 2024.
Note: All figures verified as of July 2026. The industry breakdown and Dynamic Yield figures come from a rolling benchmark dashboard and should be treated as directional; headline figures are refreshed at least twice a year.
![19.3% of Online Orders Are Returned: 2026 [Benchmarks]](/_astro/ecommerce-return-rate-statistics-2026.CZg1x-y__1IyODE.webp)