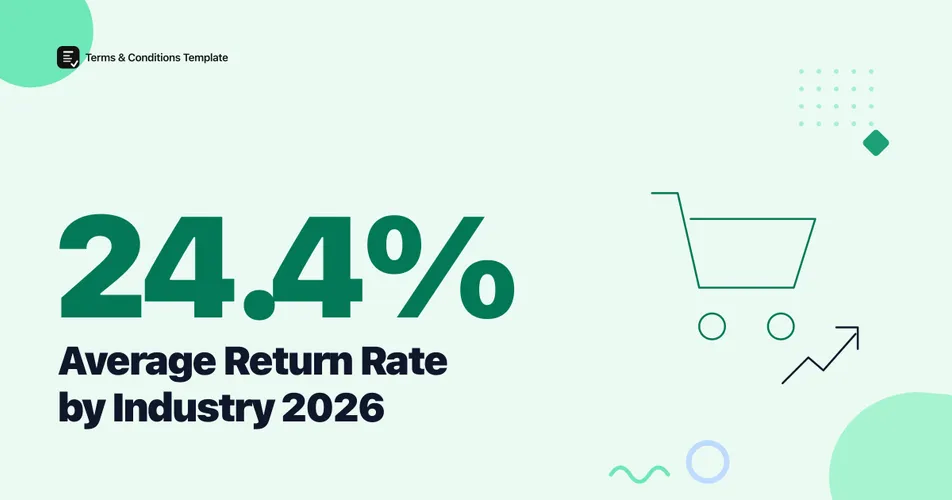
Apparel and footwear return at 24.4% online, the highest average return rate of any major retail industry, according to Coresight Research’s 2023 survey of US apparel decision-makers. That is nearly five points above the 19.3% blended online return rate the National Retail Federation and Happy Returns measured in 2025, and it is the reason a single headline return-rate figure tells a retailer very little about its own category.
A furniture seller and a swimwear brand publishing the same generic return policy are solving two different problems. One sees a return once in a while for damage in transit; the other sees roughly one order in five come back for fit alone. The benchmarks below break the blended average apart by industry, channel, and category so a merchant can compare against a number that actually matches what they sell.
What is the average return rate by industry in 2026?
The blended online return rate across every category was 19.3% in 2025, per the National Retail Federation and Happy Returns’ joint survey of 2,006 consumers and 358 ecommerce professionals at large US retailers. But that single figure hides a wide spread. Apparel and footwear run well above it at 24.4%, swimwear as a standalone vertical ran close behind at 21.6%, and in-store purchases sit far below both at 10.02%.
Figure 1: Return rate by industry vertical and sales channel. Sources: Coresight Research (2023), Loop Returns Winter 2024 Benchmark Report, National Retail Federation/Happy Returns (2025), National Retail Federation/Appriss Retail (2023).
Warning
These four figures come from three different research organizations using three different survey methods: a 100-respondent professional survey (Coresight), a portfolio analysis of returns Loop Returns actually processed (22 million returns across 4,000-plus Shopify brands), and a consumer/merchant survey (NRF). Treat this as a directional comparison of industry benchmarks, not a single continuously-measured series.
Every category above the 19.3% blended line is a signal that a generic, one-size-fits-all return policy is probably under-serving that category’s real return volume.
Why is the apparel return rate so much higher than other categories?
Size and fit account for the majority of apparel returns. Coresight Research’s 2023 survey of 100 senior managers at US apparel and footwear brands and retailers with $10 million or more in annual revenue found that 53% of returns were driven by a size or fit issue, well ahead of color mismatches (16%) and items arriving damaged (10%).
Figure 2: Share of apparel return reasons cited by surveyed retailers. Source: Coresight Research, “The True Cost of Apparel Returns” (2023), survey of 100 US apparel and footwear decision-makers, margin of error plus-or-minus 10%.
The same report found pants, shirts and blouses, dresses, and outerwear returned more often than suits, skirts, or undergarments, a pattern consistent with fit sensitivity rather than any single garment defect. A policy that spells out sizing guidance and a defined exchange path addresses the driver behind more than half of this category’s returns directly.
Which specific product categories return the most?
Within apparel, swimwear stood out as the single highest-returning vertical in Loop Returns’ Winter 2024 Benchmark Report, which analyzed 22 million returns processed across more than 4,000 Shopify brands spanning ten industry verticals, putting swimwear’s return rate at 21.6%. Separately, Statista Consumer Insights’ 2025 US survey found clothing was the category consumers most often said they had returned in the past 12 months, at 25% of respondents, followed by shoes at 17% and accessories at 12%; roughly half of respondents reported no returns in that period at all.
| Category | Share of shoppers who returned an item |
|---|---|
| Clothing | 25% |
| Shoes | 17% |
| Accessories | 12% |
Statista Consumer Insights, US, published April 2025. This measures the share of surveyed shoppers who returned at least one item in that category in the past 12 months, not an order-level return rate; the same release notes that furniture, books, and consumer electronics see lower rates without publishing exact figures for those categories.
For the order-level breakdown behind that 19.3% blended figure across all product types, not just fashion, see our deeper look at ecommerce return rate data for 2026.
How does the online return rate compare with in-store and blended averages?
Online orders return at roughly double the rate of in-store purchases. National Retail Federation and Appriss Retail’s 2023 report put the overall retail return rate at 14.5%, with online purchases returned at 17.6% and in-store purchases at just 10.02%. By 2025, the NRF and Happy Returns measured the online-only rate at 19.3%, the highest reading in that series since 2021.
Figure 3: Return-rate benchmarking and policy milestones, 2022 to 2026. Sources: National Retail Federation/Appriss Retail, Coresight Research, Loop Returns, CNBC citing NRF.
If the general question behind this list is what percentage of online purchases are returned overall, the blended answer is 19.3%. Individual industries sit meaningfully above or below that number, which is exactly why a category-specific benchmark matters more than the headline figure for setting your own return window.
A merchant deciding how strict to make condition requirements and processing windows can use the industry benchmark itself as a simple test.
Figure 4: A policy-setting decision path based on a category’s benchmark return rate. Source: synthesized from the industry return-rate benchmarks in Figure 1.
Are retailers changing return policies because of high industry return rates?
Retailers are responding directly to these industry benchmarks with tighter terms. 72% of US merchants added a return or restocking fee or limited their return options in the past year, up from 66% the year before, according to the National Retail Federation as reported by CNBC in January 2026. At the same time, 82% of shoppers told the NRF and Happy Returns in 2025 that free returns remain an important purchase consideration, and 81% said they review a store’s return policy before buying.
Figure 5: Blended online return rate trend against which industry-specific rates like apparel’s 24.4% are measured. Sources: National Retail Federation/Appriss Retail (2021-2023) and National Retail Federation/Happy Returns (2024-2025).
That tension, rising fees against a rising expectation of free and clearly stated returns, is why the return policy itself carries measurable weight before a sale even happens. Baymard Institute’s aggregate of 50 cart abandonment studies found 13% of shoppers who abandoned a cart cited an unsatisfactory return policy as a reason. Our Refund Policy Generator builds a category-specific policy from your actual return window, restocking fee, and condition requirements in a few minutes, rather than a generic clause copied from a store in a lower-return category.
The Bottom Line
The number that matters most for any single merchant in 2026 is not the 19.3% blended online average, it is the rate for their own industry. Apparel and footwear sit nearly five points above that blended figure at 24.4%, driven mostly by size and fit rather than defects, while in-store purchases run at less than half the online rate. Retailers are responding with tighter fee and restocking terms, 72% of them in the past year alone, even as shoppers keep naming a clear, fair return policy as a real factor in whether they buy at all. Setting a category-appropriate return window, condition requirement, and refund method, rather than copying industry-wide figures wholesale, is the direct, sourced conclusion this data points to.
Frequently Asked Questions
What is the average return rate by industry in 2026? Apparel and footwear return at 24.4% online, the highest documented industry average, per Coresight Research’s 2023 survey of 100 US apparel decision-makers. That compares with a 19.3% blended online average across all categories and 10.02% for in-store purchases, both from National Retail Federation research.
Which product category has the highest return rate? Apparel and footwear lead at 24.4% (Coresight Research, 2023). Within specific verticals, swimwear was the single highest-returning category Loop Returns tracked in its Winter 2024 Benchmark Report, at 21.6% across 22 million processed returns.
How does the online return rate compare to in-store returns? Online purchases return at roughly double the rate of in-store purchases: 19.3% online versus 10.02% in-store, according to National Retail Federation and Appriss Retail’s 2023 report.
Are retailers charging more return fees because of high return rates? Yes. 72% of US merchants added a return or restocking fee or limited return options in the past year, up from 66% the year before, according to the National Retail Federation as reported by CNBC in January 2026.
Sources and References
- Coresight Research. (2023). “The True Cost of Apparel Returns.” Survey of 100 US apparel and footwear brand and retailer decision-makers with $10 million or more in annual revenue, conducted March 2023, margin of error plus-or-minus 10%.
- National Retail Federation and Happy Returns. (2025). “2025 Retail Returns Landscape.” Survey of 2,006 consumers and 358 ecommerce professionals at US retailers with over $500 million in revenue, conducted summer 2025.
- National Retail Federation and Appriss Retail. (2023). “2023 Consumer Returns in the Retail Industry.”
- Loop Returns. (2024). “Winter 2024 Benchmark Report.” Analysis of 22 million returns processed across more than 4,000 Shopify brands spanning ten industry verticals, published August 2024.
- Statista Consumer Insights. (2025). “Clothing and Shoes Are the Most Returned Online Purchases.” US consumer survey, published April 2025.
- CNBC. (2026). “Returning holiday purchases: Shoppers focus on return policies.” Cites National Retail Federation data on merchant return-fee adoption, published January 2026.
- Baymard Institute. “50 Cart Abandonment Rate Statistics.” Aggregate of 50 published studies, data spanning 2006-2025.
Note: All figures verified as of August 2026. Industry-level return rates are refreshed at least twice a year as new benchmark reports are published.