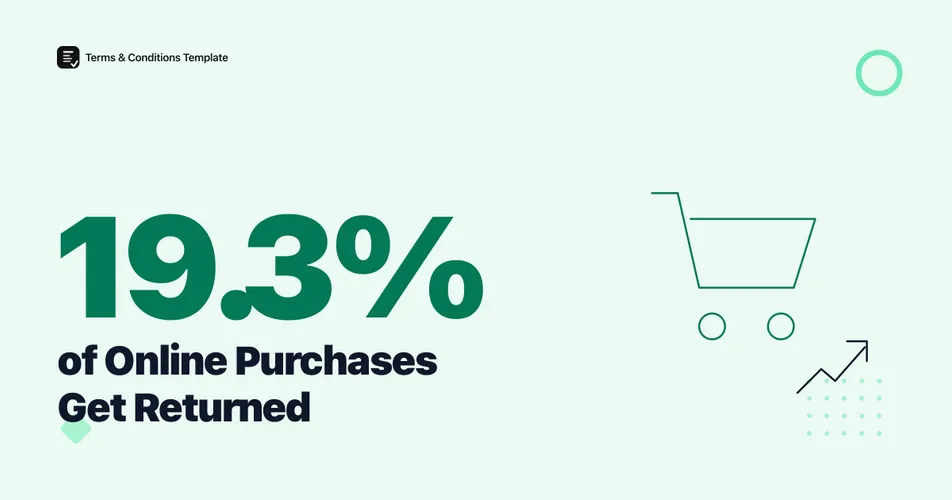
An estimated 19.3% of online purchases were returned in 2025, according to the National Retail Federation (NRF) and Happy Returns’ joint survey of 2,006 consumers and 358 ecommerce professionals at large US merchants, conducted in summer 2025. That figure sits well above the 15.8% return rate across retail overall, because a shopper buying online cannot try an item on or hold it before deciding to keep it. The gap between online and in-store behavior is the central fact behind every number in this post.
If you sell online, that gap is not a rounding error. It sets your reverse logistics budget, shapes your return policy, and increasingly decides whether a first-time buyer becomes a repeat one.
What percentage of online purchases are returned?
19.3% of online purchases were returned in 2025, per the NRF and Happy Returns, down slightly from an online return rate that has hovered near one in five orders for the past two years. That compares to a blended 15.8% return rate across all retail channels, and a total of $849.9 billion in returned merchandise for 2025, a slight decrease from $890 billion in 2024.
Figure 1: Online purchases return at a materially higher rate than retail overall. Source: NRF and Happy Returns, 2025 Retail Returns Landscape.
The online-versus-in-store gap has held for years because it comes from a structural cause, not a passing trend: shoppers cannot touch, try on, or verify fit and quality before checkout. Any category where physical inspection matters most, apparel above all, inherits the widest gap.
Which categories have the highest online return rates?
Return rates by category range from single digits to nearly half of all orders. Apparel commonly runs 20% to 40%, footwear tracks close behind, while electronics sit at 8% to 15% and beauty runs 4% to 12%, according to Appriss Retail and Deloitte’s 2024 Consumer Returns in the Retail Industry report, based on a survey of 150 North American retail executives, 1,000 consumers, and US Census Bureau data.
| Category | Typical online return rate |
|---|---|
| Apparel | 20% to 40% |
| Electronics | 8% to 15% |
| Beauty | 4% to 12% |
| All online purchases | 19.3% |
Table 1: Return rate by category against the 19.3% online-wide benchmark. Source: Appriss Retail and Deloitte (2024); NRF and Happy Returns (2025).
The pattern is consistent across every study in this space: categories bought for fit, sizing, or subjective preference return at multiples of the average, while categories bought for a fixed specification return well under it. A retailer’s realistic return-rate target should start from its category mix, not from the blended 19.3% headline.
Figure 2: Category return-rate ceilings against the online-wide average. Source: Appriss Retail and Deloitte (2024).
Is the US return rate typical, or is it different elsewhere?
The US is not an outlier. The UK’s online non-food return rate is forecast at 19.5% for 2025, down from 21% in 2024, according to Retail Economics and ZigZag’s joint benchmark, which analyzed live returns journeys at 100 leading UK retailers alongside a nationally representative survey of 2,000 consumers. That is within a point of the US online figure, and both markets show the same direction: return rates easing slightly as retailers add return fees and tighten policies.
Figure 3: The US and UK online return rate moved in step across 2024 and 2025. Note: the US 2024 figure (16.9%) is the blended retail rate, not online-specific; a directly comparable US online-only 2024 figure was not published. Sources: NRF/Happy Returns; Retail Economics/ZigZag.
Fee structures explain part of the decline in both countries. In the UK, 42% of the 100 retailers ZigZag benchmarked now charge for returns outside delivery fees, rising to 80% among young-fashion retailers and dropping to 11% in luxury. Only 24 of the 100 retailers studied offered fully free returns with no fee of any kind.
Do online return rates spike around the holidays?
Yes, sharply. The NRF projected 17% of holiday season sales would be returned in 2025, close to prior years, but the post-holiday surge concentrates that volume into a few weeks. Adobe Analytics, analyzing over 1 trillion visits to US retail sites, found returns jumped 25% to 35% in the final week of December 2025 compared to earlier in the season, and stayed 8% to 15% above baseline through the first two weeks of January 2026.
Figure 4: The post-holiday return surge, week by week. Source: Adobe Analytics, 2025 holiday season data covering over 1 trillion US retail site visits.
That two-week window is when reverse logistics capacity gets tested hardest. A refund policy that spells out return windows, restocking fees, and holiday-specific extensions before the surge hits gives both staff and shoppers a clear reference point instead of case-by-case judgment calls.
Who returns the most, and are returns fraud a factor?
Younger shoppers return the most by volume. Shoppers aged 18 to 30 averaged 7.7 online returns in the past 12 months, the highest of any generation the NRF measured in its 2025 survey. Consumer attitudes toward returns are shifting too: 45% of shoppers told the NRF it is acceptable to “bend the rules” when returning an item, and 82% now cite free returns as an important purchase consideration, up from 76% in 2024.
Fraud sits inside, not alongside, the 19.3% figure. The NRF put fraudulent returns at 9% of all returns in 2025, while Appriss Retail’s 2024 report measured a higher 15.14% fraud share against a different, smaller returns base, so the two figures are not directly comparable year over year.
Figure 5: Fraud’s share of the 2025 return total. Source: NRF and Happy Returns, 2025 Retail Returns Landscape.
The Bottom Line
The number to remember is 19.3%, the share of online purchases returned in 2025, a rate that runs well above the 15.8% blended figure for retail overall and shows no sign of closing. Category mix decides most of the gap, apparel alone can run double the online-wide average, while season decides the timing, with a third of the year’s return workload compressed into late December and early January. None of this is solved by policy language alone, but a return window, restocking-fee structure, and exception process that are written down before the holiday surge, not improvised during it, are what keep a spike in returns from becoming a spike in disputes. For the fuller cost picture behind these return rates, our ecommerce return rate benchmarks post covers dollar totals and category-level cost data in more depth.
Frequently Asked Questions
What percentage of online purchases are returned? An estimated 19.3% of online purchases were returned in 2025, according to the National Retail Federation and Happy Returns’ joint survey of 2,006 consumers and 358 ecommerce professionals at large US merchants. That is up from 16.9% for retail overall in 2024.
Is the online return rate higher than in-store returns? Yes. The 19.3% online return rate for 2025 sits well above the 15.8% blended rate across all retail channels, per the National Retail Federation, because online shoppers cannot try an item before buying it.
Which product categories get returned the most online? Apparel runs 20% to 40%, while electronics run 8% to 15% and beauty runs 4% to 12%, according to Appriss Retail and Deloitte’s 2024 Consumer Returns in the Retail Industry report (n=150 retail executives, 1,000 consumers).
How much do online returns spike after the holidays? Adobe Analytics found returns rose 25% to 35% in the final week of December 2025 compared to earlier in the season, with return volume staying 8% to 15% above baseline through the first two weeks of January, based on analysis of over 1 trillion visits to US retail sites.
Sources and References
- National Retail Federation and Happy Returns. (2025). “2025 Retail Returns Landscape.” Survey of 2,006 consumers and 358 ecommerce professionals at large US merchants, conducted summer 2025.
- National Retail Federation. (2025). “Consumers Expected to Return Nearly $850 Billion in Merchandise in 2025.” Official press release with methodology detail.
- Appriss Retail and Deloitte. (2024). “2024 Consumer Returns in the Retail Industry Report.” Survey of 150 North American retail executives, 1,000 consumers, and US Census Bureau data.
- Retail Economics and ZigZag. (2025). “UK Returns Benchmark 2025.” Live returns benchmarking of 100 UK retailers and a nationally representative survey of 2,000 consumers.
- Adobe Analytics. (2026). “Holiday Shopping Season” report, including post-holiday returns data. Analysis of over 1 trillion visits to US retail sites during the 2025 holiday season.
Note: All figures verified as of August 2026. Return rate data is refreshed at least twice a year to keep pace with new NRF, Appriss Retail, and Adobe Analytics releases.