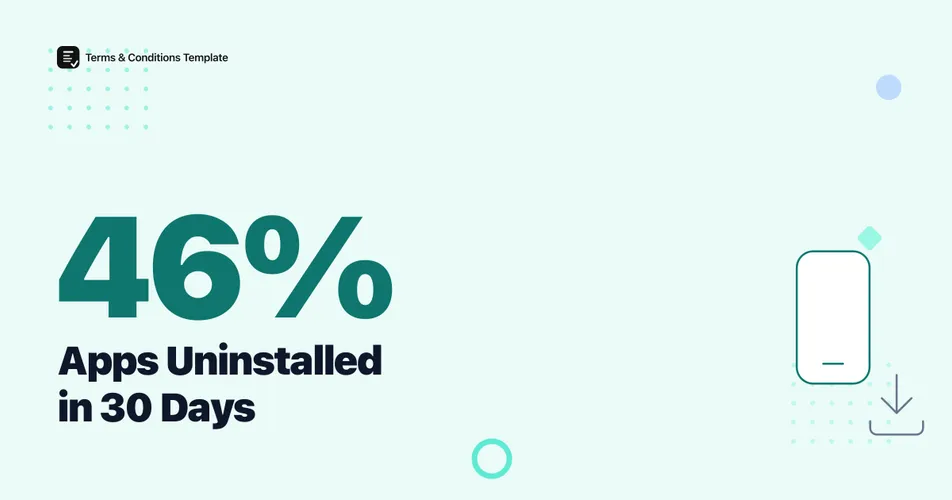
46.1% of installed apps are uninstalled within 30 days, and fewer than 5% of users remain active by then, according to AppsFlyer’s 2025 Uninstall Benchmarks Report, based on more than 1.3 billion Android installs. That churn sits next to a mobile economy that keeps growing anyway: apps generated $167 billion in 2025, per Sensor Tower’s State of Mobile 2026 report, even as most people who download an app stop opening it within a month. The numbers below cover usage, downloads, and revenue side by side, so a full picture emerges of an industry that is both booming and leaking users at the same time.
How many apps get uninstalled within 30 days of download?
Nearly half of what people install, they delete within a month. AppsFlyer’s 2025 report, drawn from more than 1.3 billion Android installs and 400 million-plus recorded uninstalls, puts the average uninstall rate at 46.1% within 30 days. The report also finds that the single biggest wave of uninstalls happens on day one, often before a user has given the app a real chance.
That first-week drop-off shapes everything downstream. An app that survives the first 24 hours has already cleared the hardest filter; one that does not is simply gone, license terms and all, before anyone read a word of them.
Apps that fail fast rarely fail because of the terms they operate under. They fail because the first session did not deliver, and a deleted app takes any unread legal agreement down with it.
What does the app retention funnel look like day by day?
Retention drops sharply and keeps dropping. Cross-industry mobile retention benchmarks tracked through 2025 and into 2026 put Day 1 retention at roughly 25% of installs, meaning about three in four users never reopen an app after their first session. These blended, cross-app benchmarks do not publish one unified sample size the way AppsFlyer’s uninstall figure does, so treat the shape of the curve as more reliable than the exact percentage at any single day.
Figure 1: The retention funnel most installs fall out of before Day 30. Source: AppsFlyer 2025 Uninstall Benchmarks Report; cross-industry retention benchmarks, 2025-2026.
Most of the users inside that 46% never opened the license terms they agreed to at install, because they never opened the app long enough to reach a settings screen. A short, front-loaded EULA generator that states what a user is agreeing to on the very first screen at least gives that agreement a chance to be read before the app is deleted, rather than buried three menus deep where almost nobody who churns in week one will ever see it.
Retention is the real filter mobile apps have to pass, and most do not clear it by Day 30.
How much revenue did mobile apps generate in 2025?
Mobile apps generated $167 billion in in-app purchase revenue in 2025, up 10.6% year over year, according to Sensor Tower’s State of Mobile 2026 report. For the first time in the report’s tracking history, non-gaming apps out-earned games: roughly $85 billion from non-gaming categories against $82 billion from games, which grew a comparatively flat 1% year over year.
Apple and Google split that revenue unevenly. The App Store pulled in $117.6 billion of the total, a 70.5% share, while Google Play brought in $49.2 billion.
Figure 2: App Store versus Google Play consumer spending. Source: Sensor Tower, State of Mobile 2026, full-year 2025 data.
Our companion piece on App Store downloads and revenue breaks that same $167 billion figure down further by app count and rejection data if you need the store-level detail rather than the usage side covered here.
Revenue is climbing even as the population of users who stick around keeps shrinking, which means the apps that survive the retention funnel are extracting more value per remaining user than they were a year ago.
How many apps were downloaded in 2025?
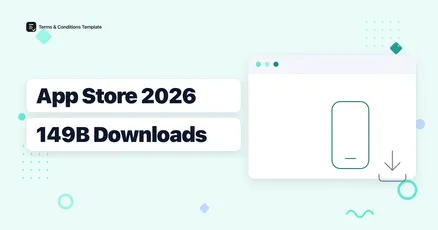
Apps were downloaded 149 billion times across the App Store and Google Play combined in 2025, according to Sensor Tower, essentially flat at +0.8% year over year after surpassing the prior high set in 2023. India led every other country by a wide margin, at 25.5 billion installs, or about 17.1% of the global total. The United States followed at 12.6 billion installs, roughly 8.5% of downloads worldwide.
Figure 3: Global share of 2025 app downloads by leading market. Source: Sensor Tower, State of Mobile 2026.
Download volume and revenue are no longer the same story. India drives the largest share of installs but a small share of spending, while the US drives the opposite pattern, generating $59 billion in app revenue despite trailing India in downloads. Volume and monetization now pull in different directions depending on the market.
Is generative AI changing how people use mobile apps?
Yes, and quickly. Generative AI app revenue climbed from $30 million in 2022 to $455 million in 2023 to $1.3 billion in 2024, according to Sensor Tower’s tracking of AI chatbot and AI art generator apps. By 2025, revenue across the broader generative AI app category neared $5 billion, per the State of Mobile 2026 report, while AI app downloads doubled year over year to 3.8 billion.
Figure 4: Generative AI app revenue growth. Source: Sensor Tower, State of AI Apps: Market Overview 2025 and State of Mobile 2026.
Time spent tells the same story from a different angle: people spent 48 billion hours inside generative AI apps in 2025, 3.6 times the 2024 total, and short-form drama and AI apps posted download growth of 278% and 148% year over year respectively, the two fastest-growing subgenres Sensor Tower tracked.
AI apps are not a side category anymore. They are one of the few places in the mobile economy where both downloads and revenue are still accelerating at the same time.
What are the biggest mobile app milestones from 2022 to 2026?
Figure 5: Key mobile app market milestones. Sources: Sensor Tower, State of Mobile 2026 and State of AI Apps: Market Overview 2025; AppsFlyer, 2025 Uninstall Benchmarks Report.
App uninstalls and retention, by the numbers
| Metric | Value | Source |
|---|---|---|
| Apps uninstalled within 30 days | 46.1% | AppsFlyer, 2025 (1.3B+ Android installs) |
| Users still active on Day 1 | ~25% | Cross-industry retention benchmarks, 2025-2026 |
| Users still active on Day 30 | ~5% | Cross-industry retention benchmarks, 2025-2026 |
App Store vs Google Play at a glance
| Platform | Consumer spend, 2025 | Share of $167B total | Apps listed |
|---|---|---|---|
| Apple App Store | $117.6 billion | 70.5% | 2.42 million |
| Google Play | $49.2 billion | 29.5% | 1.58 million |
Source: Sensor Tower, State of Mobile 2026, full-year 2025 data.
The Bottom Line
The mobile app market in 2026 is really two markets layered on top of each other. One is a $167 billion revenue story that keeps climbing, led by non-gaming apps and an AI category growing faster than anything else Sensor Tower tracks. The other is a 46.1% uninstall story, where nearly half of what gets installed is gone within a month and only about 5% of users are still around by Day 30. Both are true at once. For anyone building or publishing an app, the practical takeaway is that the first session, not the legal fine print, decides whether a user sticks around, but a short, visible EULA still matters for the users who do stay long enough to read one.
Frequently Asked Questions
What percentage of apps get uninstalled after users download them? 46.1% of installed apps are uninstalled within 30 days, according to AppsFlyer’s 2025 Uninstall Benchmarks Report, based on more than 1.3 billion Android installs and 400 million-plus uninstalls. Fewer than 5% of users remain active by Day 30.
How much money did mobile apps make in 2025? Mobile apps generated $167 billion in in-app purchase revenue in 2025, up 10.6% year over year, according to Sensor Tower’s State of Mobile 2026 report. Non-gaming apps, at roughly $85 billion, out-earned games for the first time.
How many apps were downloaded in 2025? Apps were downloaded 149 billion times across the Apple App Store and Google Play in 2025, essentially flat at +0.8% year over year, per Sensor Tower. India accounted for 25.5 billion of those installs, more than any other country.
Is generative AI driving mobile app growth? Yes. Generative AI app revenue climbed to nearly $5 billion in 2025, up from $1.3 billion in 2024, while AI app downloads doubled year over year to 3.8 billion, according to Sensor Tower’s State of Mobile 2026 report.
Sources and References
- Sensor Tower. (2026). “2026 State of Mobile: AI Moves Mobile into Its Next Phase.” Full-year 2025 downloads, revenue, and usage data across iOS and Google Play.
- Sensor Tower. (2025). “State of AI Apps: Market Overview 2025.” Generative AI app revenue and download trends, 2022-2024.
- AppsFlyer. (2025). “App Uninstall Benchmarks Report, 2025 Edition.” Analysis of over 1.3 billion Android installs and 400 million-plus uninstalls.
- TechCrunch. (2026). “Consumers spent more on mobile apps than games in 2025, driven by AI app adoption.” Reporting on Sensor Tower’s State of Mobile 2026 findings.
Note: All figures verified as of August 2026. App usage, retention, and revenue figures shift quickly as new quarterly reports publish, so headline figures here are refreshed at least twice a year.