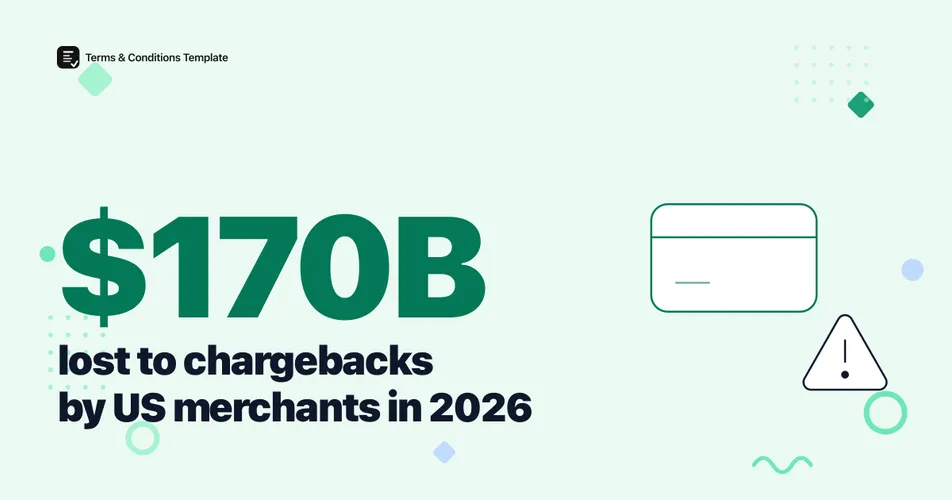
Chargeback fraud and misuse now cost US merchants more than $170 billion a year, according to Chargebacks911’s 2025 Cardholder Dispute Index, a survey of over 1,200 cardholders across the US and UK published in 2025. That figure sits on top of a chargeback rate that jumped 53% in three quarters during 2025. The numbers below explain why disputes have become one of the most expensive line items in ecommerce, and what a clear refund policy can and cannot do about it.
If you sell online, the data says two things at once: disputes are getting more frequent, and a growing share of them are not fraud in the traditional sense at all. Here is the current data on rates, costs, and where the money actually goes.
How much do chargebacks cost merchants?
Chargeback fraud and misuse cost US merchants more than $170 billion annually, per Chargebacks911’s 2025 Cardholder Dispute Index. That figure covers the direct transaction reversal plus the downstream cost of disputes merchants never recover. Globally, Mastercard and Datos Insights project the value of chargebacks will climb from $33.79 billion in 2025 to $41.69 billion by 2028, a 23% increase in three years.
Figure 1: Global chargeback value is projected to rise from $33.79 billion in 2025 to $41.69 billion by 2028. Source: Mastercard and Datos Insights, 2025 Global Chargebacks Outlook. Intermediate years are linearly interpolated between the two published data points, not independently reported figures.
Volume is climbing alongside value. Mastercard and Datos Insights project 261 million chargebacks worldwide in 2025, rising to 324 million by 2028, a 24% increase. A resolution starts with clear terms: publishing a plain-language refund policy generator that states the return window and dispute process up front reduces the confusing-charge disputes that drive a meaningful share of that volume.
The cost curve is steep and still rising, which is why a growing number of merchants are treating dispute prevention as a budget line, not an afterthought.
What is the average chargeback rate in 2026?
The general chargeback rate reached 0.26% in Q3 2025, up 53% from 0.17% in Q1 2025, according to Sift’s Q4 2025 Digital Trust Index. That Q1 2025 figure itself was a 23% year-over-year decline from 0.22% in Q1 2024, so 2025 opened low and then accelerated sharply through the year. Industry benchmarks aggregated by Chargebacks911 and other processors put general card-not-present ecommerce in the 0.6% to 1.0% range on average, with the all-industry blended figure closer to 0.65%.
Figure 2: The chargeback rate fell year over year into Q1 2025, then rose 53% by Q3 2025. Source: Sift, Q4 2025 Digital Trust Index.
The average dispute also grew more expensive before pulling back: Sift measured an average chargeback value of $361.31 in Q1 2025, a 48% year-over-year jump, before it eased to $301.91 by Q3 2025. A rate that swings this much within a single year is a reminder to benchmark against the current quarter, not a figure from a year-old report.
How do chargeback rates vary by industry?
Rates differ sharply by category, and some categories moved far faster than others in 2025. Sift recorded a 233% year-over-year increase in retail ecommerce chargeback rates during 2025, followed by transportation at 226%, B2C SaaS and services at 83%, and B2B SaaS and services at 77%.
Baseline rates by vertical, aggregated from processor benchmark data covering 2025 and early 2026, show why some merchant categories pay far more in card-network monitoring fees than others.
| Industry | Typical chargeback rate | Risk tier |
|---|---|---|
| Restaurants (card-present) | 0.12% | Low |
| Software and SaaS | 0.66% | Moderate |
| General online retail | 0.60% to 1.00% | Moderate |
| Subscription services | 0.90% to 1.20% | High |
| Travel and hospitality | 0.89% to 2.00% | High |
| Electronics | 1.00% to 2.00% | High |
Source: Chargebacks911, ClearlyPayments, and 2Accept processor benchmark data, 2025 to 2026.
Both card networks flag merchants who cross a threshold. Visa’s Acquirer Monitoring Program consolidated several older fraud and dispute programs into one ratio in 2025, with a merchant-level threshold reported at 1.5% as of April 2026, down from 2.2% previously. Reporting on a further step-down to 0.9% in early 2026 is inconsistent across sources and not confirmed in Visa’s own published documentation as of this writing, so treat any specific 0.9% date as unverified rather than settled.
A merchant running two or three points above their category’s baseline is not just losing revenue to reversals, they are approaching a ratio that can trigger network monitoring and higher processing costs.
What percentage of chargebacks are actually fraud?
A large and growing share of disputes are not fraud in the traditional stolen-card sense at all. Visa’s own research puts friendly fraud, meaning a dispute filed on a transaction the cardholder actually authorized and received, as high as 75% of all chargebacks. Sift’s Q4 2025 data, using a stricter definition, measured first-party fraud at roughly 45% of merchant dispute volume in 2025, up from a smaller share the year before, and found that first-party fraud represented 36% of all reported fraud in 2024, up from just 15% one year earlier.
Figure 3: Visa’s upper-bound estimate for the share of chargebacks driven by friendly fraud rather than stolen-card fraud. Source: Visa published research, cited across Chargebacks911 and Sift 2025 reporting.
Warning
Treat “up to 75%” as an upper bound, not a universal average. Visa has not published the underlying sample size or methodology behind that specific figure in a way we could independently verify, and Sift’s own 2025 survey data, which does disclose its methodology, measures first-party fraud closer to 45% of dispute volume. The true figure likely varies significantly by merchant category and region, and the two networks appear to define “friendly fraud” slightly differently in their public materials.
Consumer behavior explains part of the gap between the two figures. In Sift’s October 2025 survey of 1,075 US adults, 16% admitted to filing a false fraud claim despite being satisfied with a purchase, most often citing a delayed delivery or the belief that the merchant behaved unethically. Whether measured at 45% or 75%, the direction is the same: a rising share of chargebacks start with the cardholder, not with a stolen card.
Where do first-party fraud claims come from?
Sift’s October 2025 consumer survey traced first-party disputes to a specific set of triggers rather than a single cause. Unauthorized purchases (often the buyer simply not recognizing a billing descriptor) accounted for 38% of disputes, delayed refunds for 18%, and missing or late deliveries for 17%.
Figure 4: The decision path from a confusing charge to a filed dispute. Source: synthesized from Sift’s Q4 2025 consumer dispute-reason data and Chargebacks911’s 2025 findings on bank-first resolution preference.
Chargebacks911’s own 2025 survey found a related pattern outside the reasons themselves: 76% of cardholders said they prefer to resolve a disputed charge through their bank rather than the merchant, and nearly half said they go straight to their bank without contacting the merchant first. A clear billing descriptor and a fast, visible refund process both interrupt this path before it reaches a chargeback.
How well do merchants fight back, and what does it cost?
Merchants who contest a chargeback through representment win an average of 45% of the time, but the net recovery rate across all disputes filed, including the ones never worth fighting, is closer to 18%, according to industry-wide benchmark data compiled by Chargebacks911. The gap between those two numbers is the real cost of chargebacks: most of them are never recovered at all.
The full cost runs well past the disputed amount. LexisNexis research found merchants lost $4.61 for every $1 of fraud in 2025, a 37% increase from five years earlier, once the reversed transaction, the cost of goods the customer keeps, network fees, and the labor of assembling evidence are all counted. Applied to Sift’s Q1 2025 average dispute value of $361.31, a single chargeback’s all-in cost can run well over $1,600 before any card-network monitoring fees kick in.
Figure 5: Key chargeback cost and enforcement milestones. Sources: LexisNexis fraud-cost research, Sift Q4 2025 Digital Trust Index, Visa Acquirer Monitoring Program documentation.
Prevention tools help but do not close the gap on their own. Merchants using automated dispute-response systems report roughly a 33% reduction in chargebacks, and 77% of merchants surveyed by Chargebacks911 in 2025 said they now lean on card-network compelling-evidence rules to fight disputes rather than building a case from scratch each time.
The Bottom Line
The headline number for 2026 is not the chargeback rate itself, it is the $170 billion in annual US merchant losses that rate produces once you count everything past the reversed transaction. A rate that rose 53% in three quarters means last year’s benchmark is already stale, and a friendly-fraud share as high as 75% means the fastest fix is often not a fraud tool at all: it is a refund policy and billing descriptor clear enough that a cardholder resolves the confusion with you instead of their bank. Merchants who publish clear return windows, dispute contact paths, and refund timelines directly address the delayed-refund and missing-delivery triggers behind a large share of first-party disputes.
Frequently Asked Questions
How much do chargebacks cost merchants? Chargeback fraud and misuse cost US merchants more than $170 billion annually, according to Chargebacks911’s 2025 Cardholder Dispute Index, a survey of over 1,200 cardholders in the US and UK.
What is the average chargeback rate in 2026? Sift’s Q4 2025 Digital Trust Index put the general chargeback rate at 0.26% in Q3 2025, up 53% from 0.17% in Q1 2025. Industry averages for card-not-present ecommerce typically run between 0.6% and 1.0%.
What percentage of chargebacks are friendly fraud? Visa research puts friendly fraud, disputes filed on legitimate transactions, as high as 75% of all chargebacks. Sift’s Q4 2025 data separately measured first-party fraud at roughly 45% of merchant dispute volume in 2025.
What is the true cost of a single chargeback? LexisNexis research found merchants lost $4.61 for every $1 of fraud in 2025, a 37% increase from five years earlier. Applied to Sift’s Q1 2025 average dispute value of $361.31, the all-in cost of one chargeback runs well over $1,600 before monitoring fees.
Sources and References
- Chargebacks911. (2025). “2025 Cardholder Dispute Index.” Survey of 1,200+ cardholders, US and UK.
- Sift. (2025). “Q4 2025 Digital Trust Index: Dispute & Chargeback Data and Insights.” Includes an October 2025 consumer survey, n=1,075 US adults.
- Mastercard and Datos Insights. (2025). “2025 Global Chargebacks Outlook.”
- Mastercard. (2025). “Scaling Efforts to Combat Friendly Fraud.”
- Chargebacks911. (2025-2026). “Chargeback Stats: All the Key Dispute Data Points.” Industry benchmark aggregation.
- Eightx. (2026). “Average Chargeback Rate by Vertical: 2026 Benchmarks.” Aggregates Chargebacks911, ClearlyPayments, and 2Accept processor data.
- Merchant Risk Council. (2026). “Stricter VAMP Ratio Thresholds Are Now in Effect.”
Note: All figures verified as of July 2026. Chargeback rates and network monitoring thresholds change quarterly, so headline figures are refreshed at least twice a year. The Visa VAMP 0.9% threshold reporting is flagged in-text as unverified and should be re-checked before each refresh.

![19.3% of Online Orders Are Returned: 2026 [Benchmarks]](/_astro/ecommerce-return-rate-statistics-2026.CZg1x-y__1IyODE.webp)