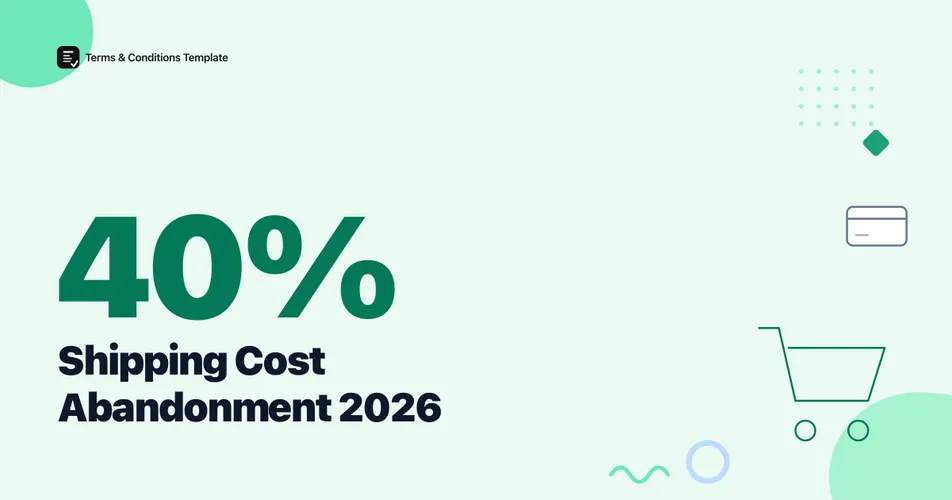
Shipping costs are the single biggest reason online shoppers abandon a cart. In 2026, 40% of shoppers who abandon an order blame extra costs, mainly shipping, tax, and fees, according to Baymard Institute’s ongoing checkout abandonment research. Every other reason on the list trails well behind it.
That one figure explains more checkout friction than any single design fix could. The data below breaks down exactly where shipping costs bite, what shoppers now expect to pay, and how fast free shipping is becoming the default rather than the exception.
How many shoppers abandon a cart because of shipping costs?
Extra costs, mainly shipping, tax, and fees, are the single most common reason US online shoppers give for abandoning a cart: 40%, according to Baymard Institute’s ongoing survey of checkout abandonment reasons. Baymard does not publish a standalone respondent count for this specific breakdown, though the figure draws on the institute’s wider base of 20,240+ tested participants across 12 quantitative studies conducted over 14 years, and the list itself is a continually updated reference rather than a single fixed dataset. Treat it as directional and re-check it at each refresh, the same caution we apply to every rolling source in this post.
The full breakdown of related reasons shows the pattern is not just about the number itself, it is about visibility. Only 12% of shoppers say they could see or calculate the total order cost before the final checkout step, and 13% cite an unsatisfactory returns policy as their reason for leaving. Both of those are policy and layout problems a store controls directly, unlike delivery speed or a shopper’s own hesitation.
Figure 1: The four most commonly cited shipping and cost related reasons shoppers abandon a cart. Source: Baymard Institute, checkout abandonment reasons research.
| Shipping or cost related reason | Share of abandonments |
|---|---|
| Extra costs too high (shipping, tax, fees) | 40% |
| Delivery was too slow | 20% |
| Returns policy unsatisfactory | 13% |
| Couldn’t see or calculate total cost upfront | 12% |
Source: Baymard Institute, checkout abandonment reasons research.
Returns policy clarity sits inside that same cost picture, because a shopper weighing a purchase is also weighing what it costs to send an item back. A Refund Policy Generator that states the shipping cost, refund window, and return process in plain language up front removes one of the four reasons in the table above before a shopper ever reaches checkout.
Every reason in this table is fixable without a redesign. Publishing the real numbers earlier in the flow is the cheapest lever a store has.
Why do shoppers say checkout costs catch them off guard?
The 12% of shoppers who could not see the total order cost upfront are describing a specific, testable failure: shipping, tax, or fees only appearing on the final payment screen, after the shopper has already invested time filling in an address and payment details. That late reveal is what turns a manageable cost into a reason to close the tab.
Figure 2: The minimum test a checkout should pass to avoid a cost surprise late in the process. Source: derived from Baymard Institute’s checkout abandonment reasons research.
Cost surprise is not the only late-stage checkout problem in Baymard’s data. 18% of shoppers who abandon a cart do so because the site forced account creation before they could pay, a separate but related friction point covered in our guest checkout data for 2026. Both failures share the same root cause: asking for a commitment, whether it is an account or an unexpected fee, later in the process than the shopper was prepared for.
Fixing either one is a checkout-flow change, not a pricing change, and both are cheaper to fix than either sounds.
How much does free shipping influence where people buy?
45% of US adults expect free shipping on every order they place, and 16% say they will not complete a purchase at all if they have to pay for shipping, according to Radial and Dynata’s Peak Season Consumer Survey of 1,000 US adults, fielded in September 2025. That is not a preference, it is a purchase requirement for roughly one in six shoppers.
Warning
These free shipping figures come from three different 2025 surveys with different populations and different questions, not one comparable trend line. Radial and Dynata surveyed 1,000 US adults in September 2025 and disclose that sample size. The Ipsos and Criteo figures below are worldwide and reach us through eMarketer’s reporting rather than a primary report we could verify directly, and neither discloses a sample size in the material we reviewed. Treat the US figure as the most solid data point and the other two as directional context.
The global picture, as reported by eMarketer citing Ipsos and Criteo research, points the same direction even without a shared methodology. 55% of digital shoppers worldwide rank free shipping among the most important factors in where they buy online, per January 2025 Ipsos data. 42% of shoppers worldwide say they choose in-store shopping over online specifically to avoid paying for shipping, per a February 2025 Criteo survey.
Figure 3: Three different 2025 surveys, three different measures: Ipsos measures free shipping as a top purchase factor, Radial/Dynata measures shoppers who always expect it, Criteo measures shoppers who switch to in-store to avoid paying for it. Sources: Ipsos; Radial and Dynata; Criteo, as reported by eMarketer, 2025.
A store that cannot offer free shipping outright still has room to act on this data: showing the shipping cost early, and explaining what it buys, addresses the 16% who refuse to buy at all more directly than a discount code ever will.
What is a typical free shipping threshold by category?
Free shipping thresholds vary by category more than a single “free shipping over $50” rule of thumb suggests. ParcelLab’s 2025 US Ecommerce Shipping Study, based on 57 test purchases from leading US retailers conducted in February and March 2025, found thresholds ranging from $45 for homeware up to $140 for electronics, with $49 typical across multi-category retailers.
Figure 4: Minimum order value for free shipping, by category. Source: ParcelLab, 2025 US Ecommerce Shipping Study, 57 test purchases.
| Category | Free shipping threshold |
|---|---|
| Electronics | $140 |
| Fashion | $73 |
| Health & beauty | $61 |
| Multi-category | $49 |
| Homeware | $45 |
Source: ParcelLab, 2025 US Ecommerce Shipping Study.
The pattern tracks average order value: categories where a single item already costs more can set a higher bar without pushing shoppers into the 40% abandonment bucket from the cart abandonment data for 2026. A threshold set well above what a typical basket in your category actually costs recreates the same cost-surprise problem a hidden shipping fee causes.
Are more stores offering free shipping, and is that trend holding?
74% of WooCommerce orders shipped free in 2025, up from 65% in 2023, according to Metorik’s analysis of roughly 65 million orders across more than 6,000 stores using its platform. That is a nine-point jump in two years, among stores that increasingly build the shipping cost into the product price rather than surface it separately at checkout.
Figure 5: WooCommerce orders shipped free, 2023 versus 2025. Source: Metorik, 65 million orders across 6,000+ stores.
This is a WooCommerce-specific data set, not a whole-market figure, but the direction lines up with everything else in this post: shoppers expect free shipping more each year, and stores are absorbing more of the cost each year to avoid the 40% abandonment reason at the top of this page.
Figure 6: Shipping cost data points, 2023 to 2026. Sources: Metorik; Radial and Dynata; ParcelLab; Baymard Institute.
The Bottom Line
Shipping cost is not a minor line item, it is the leading reason a filled cart never turns into an order. 40% of shoppers who abandon a purchase point to extra costs, and roughly half of US adults will not buy at all, or will hesitate hard, if shipping is not free. Stores are responding: WooCommerce free shipping share jumped nine points in two years, and free shipping thresholds now track category economics instead of a flat guess. The cheapest fix available to any store is showing the real total earlier, before a shopper has invested time in the checkout flow, and pairing it with a plain-language returns and shipping cost policy so nothing about the final price is a surprise.
Frequently Asked Questions
What percentage of shoppers abandon a cart because of shipping costs? 40% of shoppers who abandon an online order blame extra costs like shipping, tax, and fees, the single largest reason for abandonment tracked, according to Baymard Institute’s ongoing checkout abandonment research.
What percentage of shoppers expect free shipping? 45% of US adults expect free shipping on every order, and 16% will not complete a purchase at all if shipping is not free, per Radial and Dynata’s September 2025 Peak Season Consumer Survey of 1,000 US adults.
What is a typical free shipping threshold? US free shipping thresholds range from about $45 for homeware to $140 for electronics, with $49 typical for multi-category retailers, according to ParcelLab’s 2025 US Ecommerce Shipping Study.
Are more online stores offering free shipping? Yes. 74% of WooCommerce orders shipped free in 2025, up from 65% in 2023, based on Metorik’s analysis of 65 million orders across more than 6,000 stores.
Sources and References
- Baymard Institute. “50 Cart Abandonment Rate Statistics.” Ongoing checkout abandonment reasons research.
- Baymard Institute. “Checkout Usability Research.” 20,240+ participants across 12 quantitative studies, 14 years of research, 335 leading e-commerce sites benchmarked.
- eMarketer. (2025). “Nearly Half of Shoppers Expect Free Shipping on Every Order.” Citing Radial and Dynata’s Peak Season Consumer Survey (n=1,000 US adults, September 2025), Ipsos (January 2025), and Criteo (February 2025).
- ParcelLab. (2025). “U.S. Ecommerce Shipping Study.” 57 test purchases from leading US retailers, February to March 2025.
- Metorik. (2025). “Free Shipping Statistics.” Analysis of roughly 65 million orders across 6,000+ WooCommerce stores.
Note: All figures verified as of September 2026. Shipping cost expectations shift with holiday seasons and carrier rate changes, so headline figures are refreshed at least twice a year.