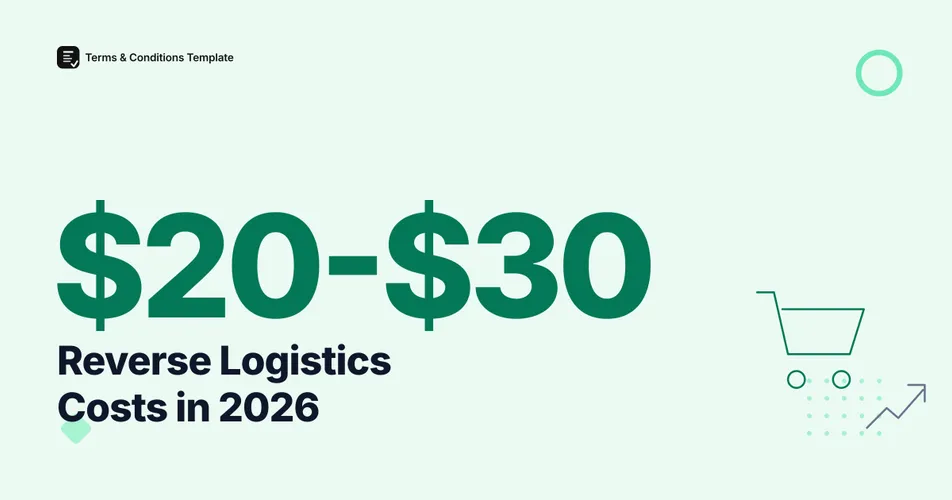
Reverse logistics, the process of getting a returned item back into inventory, resold, refurbished, or written off, now costs US retailers real money on every single order. Industry cost benchmarks widely cited across supply chain research put the cost of processing one return at $20 to $30, once outbound shipping, inbound shipping, inspection, restocking and support time are all counted. Multiply that by hundreds of millions of annual returns and reverse logistics stops being a back-office line item and becomes its own market.
Below is what the 2026 market-size, cost, and channel data actually says, and where the estimates diverge enough that you should treat a figure as directional.
How much does it cost to process a single return?
A single returned item costs a retailer an estimated $20 to $30 to process, covering return shipping, receiving and inspection, restocking labor, and customer support contact, according to cost benchmarks repeated consistently across 2025-2026 supply chain and logistics research. Some sources put the full observed range as low as $10 for a simple, undamaged item shipped a short distance, or as high as $40 for items needing inspection, repackaging, or long-haul return shipping.
Warning
We could not trace the $20-$30 figure to one single named primary study with a disclosed sample size; it is a widely repeated industry-consensus estimate across multiple supply chain and logistics publications (see Sources). Treat it as a directional benchmark rather than a precise, audited average, and expect your own per-category cost to vary with product size, return distance, and whether you outsource reverse logistics to a 3PL.
If you publish a refund policy that sets a clear return window and condition requirements up front, you reduce the share of returns that arrive damaged, incomplete, or outside a usable window, each of which pushes the per-item cost toward the high end of that $20-$30 range.
How big is the reverse logistics market in 2026?
Global Market Insights values the global reverse logistics market at $936 billion in 2026, projecting growth to $1.75 trillion by 2035 at a 7.3% compound annual growth rate. Estimates from other research firms for the same 2026 window range as high as $1.16 trillion, a gap that reflects differing definitions of what counts as “reverse logistics” (some include forward warranty logistics and recommerce, others count returns processing alone) rather than genuine disagreement about the growth trend.
Figure 1: Reverse logistics market size forecast. Source: Global Market Insights, Grand View Research industry estimates.
Every major estimate agrees on direction: reverse logistics is growing faster than retail sales overall, driven by online return volume outpacing in-store return volume.
Do online returns cost more than in-store returns?
Yes, by a wide margin. Online purchases are returned at roughly 24.5%, compared with just 8-10% for in-store purchases, based on 2024 data from the National Retail Federation and Happy Returns. Ecommerce-specific return rates reached 19.3% of online orders in 2025 per NRF and Happy Returns’ Retail Returns Landscape report, and US retailers absorbed $890 billion in returned merchandise across all channels in 2024, equal to 16.9% of total retail sales.
Figure 2: Return rate by channel and year. Source: National Retail Federation, Appriss Retail, Happy Returns Retail Returns Landscape report.
Every online order that gets returned triggers a reverse logistics chain an in-store return never touches: outbound shipping already paid, a return label to generate, a warehouse to receive and inspect the item, and a restocking or write-off decision. That is the direct link between the online-versus-in-store gap above and the market-size numbers in the previous section. For more detail on where returns land once they arrive back at a warehouse, see what percentage of purchases actually get returned.
What happens to a return once it comes back?
Reverse logistics is a decision tree, not a single step. An item moves through inspection before any cost or resale decision gets made.
Figure 3: The reverse logistics disposition path from return to final outcome. Source: synthesized from standard reverse logistics process models cited across industry research.
The final branch is not rare. A 2026 analysis of return disposition found roughly 9.5 billion pounds of returned merchandise ends up in landfills annually in the US; see the full landfill and disposition data for the breakdown by category.
Who actually handles reverse logistics?
Most large retailers do not run reverse logistics entirely in-house. Third-party logistics (3PL) providers handle more than 38% of the global reverse logistics market by value, an estimated $330.7 billion in 2025, according to Grand View Research. The remainder is split between in-house warehouse operations and retailer-branded return programs.
Figure 4: Share of the reverse logistics market operated by 3PL providers versus in-house teams. Source: Grand View Research, 2025 estimate.
Outsourcing to a 3PL shifts the $20-$30 per-item cost onto a specialist with return-focused warehouse infrastructure, which is one reason 3PL share keeps climbing even as overall return volume grows. Merchants who charge a return shipping fee, now the case at 65.2% of merchants according to 2026 data, are partly offsetting this cost directly; see the full return shipping cost data for the fee breakdown.
Where does reverse logistics cost the most, relative to return volume?
Cost per unit and return rate do not move together. A quadrant view, built from the category-level figures cited above and elsewhere in this cluster, shows why furniture and electronics returns are expensive even though they happen less often than apparel returns.
Figure 5: Illustrative placement of product categories by return rate and relative per-unit reverse logistics cost, based on the category return-rate figures and freight-cost patterns cited across this cluster, not a single unified study. Sources: category return-rate research cited throughout this article and its cluster.
Furniture and large items sit in the highest-cost quadrant despite a comparatively low return rate, because freight cost per unit dwarfs the shipping cost of a returned t-shirt.
Reverse logistics by the numbers
| Metric | Figure | Year | Source |
|---|---|---|---|
| Cost to process one return | $20 to $30 | 2025-2026 est. | Industry cost benchmarks |
| Global reverse logistics market | $936 billion | 2026 | Global Market Insights |
| US all-channel returned merchandise | $890 billion (16.9% of sales) | 2024 | National Retail Federation |
| 3PL share of reverse logistics market | 38%+ ($330.7B) | 2025 | Grand View Research |
The Bottom Line
The single number that ties this entire market together is the $20 to $30 it costs to process one return. That per-item cost, multiplied across a $936 billion global market growing at 7.3% a year, explains why reverse logistics has become a strategic line item rather than an afterthought. Online orders drive the growth, returning at roughly three times the rate of in-store purchases, and a growing share of that volume now flows through 3PL providers rather than in-house teams. A clear, current refund policy will not eliminate reverse logistics cost, but it reduces the share of returns that arrive damaged or outside a usable window, which is exactly the share that pushes per-item cost toward the expensive end of the range.
Frequently Asked Questions
How much does it cost to process a return? An estimated $20 to $30 per item once shipping, inspection, restocking and customer support are counted, according to widely cited 2025-2026 supply chain cost benchmarks. Some estimates put the full range as low as $10 or as high as $40 depending on category and shipping distance.
How big is the reverse logistics market in 2026? Global Market Insights values the reverse logistics market at $936 billion in 2026, projecting growth to $1.75 trillion by 2035 at a 7.3% compound annual growth rate. Other research firms publish estimates as high as $1.16 trillion for 2026, reflecting different definitions of what counts as reverse logistics.
Do online returns cost more than in-store returns? Yes. Online purchases are returned at roughly 24.5% versus 8-10% for in-store purchases (2024 data), and each online return typically involves outbound shipping, return shipping, and inspection costs that an in-store return skips entirely.
How much of the reverse logistics market goes through third-party providers? Third-party logistics (3PL) providers handle more than 38% of the reverse logistics market by value, an estimated $330.7 billion in 2025, according to Grand View Research.
Sources and References
- Global Market Insights. (2026). “Reverse Logistics Market Size, 2026-2035.” Market size and CAGR estimate.
- Grand View Research. (2025). “Reverse Logistics Market Size And Share Report.” 3PL share of market estimate.
- National Retail Federation. (2025). “Consumers Expected to Return Nearly $850 Billion in Merchandise in 2025.”
- National Retail Federation / Appriss Retail / Happy Returns. (2025). “Retail Returns Landscape” report. Return rate and return fraud figures.
Note: All figures verified as of August 2026. Market-size estimates vary by research firm and are refreshed at least twice a year alongside the cost and return-rate figures.