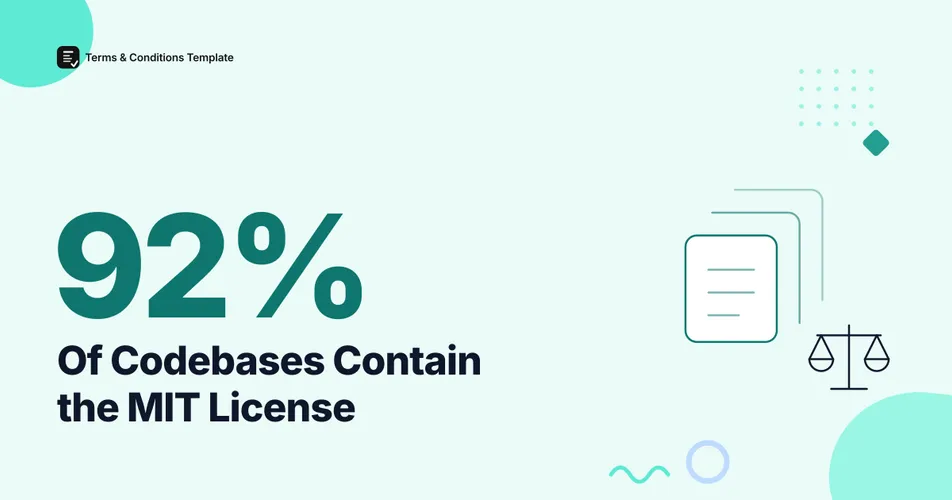
The MIT license appears in 92% of commercial codebases, according to Black Duck’s 2026 Open Source Security and Risk Analysis (OSSRA) report, which audited 947 codebases between November 2024 and October 2025. Apache 2.0 follows at 90%. Every figure below was checked against its source in November 2026.
If you ship software, you almost certainly ship someone else’s MIT code too. The ranking matters because each license comes with different duties, and your own EULA has to sit on top of all of them.
Which open source licenses are used most?
MIT leads at 92% of codebases, with Apache 2.0 at 90% and BSD 3-Clause at 85%, based on Black Duck’s 2026 OSSRA audit of 947 commercial codebases across 17 industries. The numbers add up past 100% because one codebase holds many licenses. The average application in the same report runs 1,180 open source components.
The full top ten is below. The drop from fourth place (BSD 2-Clause at 74%) to fifth (ISC at 61%) is the biggest gap in the list.
Figure 1: Share of commercial codebases containing each license, 2026 OSSRA. Source: Black Duck, 2026 OSSRA Report (947 codebases, November 2024 to October 2025).
Black Duck publishes only the top ten, so GPL and AGPL do not appear in this ranking. Black Duck gives no share for them. The only copyleft license in the top ten is the weak copyleft LGPL 2.1 or later, in 48% of codebases.
MIT, Apache 2.0 and BSD 3-Clause hold the top three spots, and the fourth license, BSD 2-Clause, trails the leader by 18 points.
How did licenses split among GitHub projects?
Among licensed public GitHub projects, MIT held 44.69%, according to GitHub’s own license analysis. That is the oldest number in this post. GitHub published the study in 2015 and last updated the page in December 2021, and it did not state a sample size. Read it as a historical baseline from years ago.
Figure 2: License share of non-fork public GitHub repositories that had a LICENSE file. The five slices shown are the largest of GitHub’s published top ten and total 93.4%. Source: GitHub, “Open source license usage on GitHub.com.”
GPL licenses held a combined 21.84% of that sample (GPLv2 at 12.96% plus GPLv3 at 8.88%). In the 2026 OSSRA codebases, the permissive trio sits far above any copyleft license that Black Duck reports. The two studies measure different things and years, but GPL looks far more common among licensed GitHub projects than in the commercial codebases Black Duck audits.
Counting only repositories with a LICENSE file also means unlicensed projects never show up, a gap we come back to below.
The old GitHub split gave GPL over a fifth of licensed projects, but commercial codebases hold mostly permissive code.
What does each language ecosystem prefer?
MIT dominates npm at 53%, RubyGems at 63.11% and Composer at 64.37%, while Apache 2.0 leads Maven at 69.18%, per a ClearlyDefined dataset from September 21, 2023, analyzed by the Open Source Initiative (OSI). OSI did not publish sample sizes for any ecosystem, and this is a 2023 snapshot, so use it for direction.
Figure 3: MIT share of components by ecosystem. Source: OSI, “The most popular licenses for each language in 2023” (ClearlyDefined data).
Two ecosystems break the pattern. Rust’s crates.io is 83.52% MIT and/or Apache 2.0 combined, because many crates are dual licensed under both. And Maven is the Apache stronghold.
Go splits three ways: 32.49% Apache 2.0, 20.1% MIT and 29.67% with no license. PyPI is more mixed than most. MIT holds 29.14%, Apache 2.0 holds 23.98%, GPL 3.0 holds 6.11%, and 23.69% of components have no license at all.
Pick a language and you pick a license culture. Java ships Apache, JavaScript and PHP ship MIT.
Are people looking up Apache 2.0 more than before?
Yes. OSI’s most-visited license pages put Apache 2.0 second in 2025 with 344k pageviews and 245k visitors, up from third place and 244.6k pageviews in 2024. MIT stayed first, though its pageviews dropped from 1.7M to 1.53M. These are lookups on OSI’s website, not a count of projects, so they show interest rather than use.
Figure 4: Pageviews on OSI license pages, in thousands. Source: OSI, “Top Open Source licenses in 2024” and “Top Open Source licenses in 2025” (published December 2024 and December 2025).
OSI counts 2025 pageviews through Plausible, which excludes ad blockers, so human traffic is likely higher and Chinese users are likely undercounted. Bot traffic is excluded. OSI’s 2025 top five was MIT, Apache 2.0, BSD 3-Clause, BSD 2-Clause and GPL 2.0, with GPL 3.0 in sixth at 55k pageviews.
MIT still draws 4.4 times the pageviews of Apache 2.0, but the gap is closing.
How do the main license families compare?
Black Duck sorts licenses into three risk classes. Permissive licenses such as MIT, Apache 2.0 and BSD count as low risk. Weak copyleft such as LGPL and MPL counts as medium. Strong copyleft such as GPL v2, GPL v3 and AGPL counts as high. The source-sharing column below is the usual reading of each family, so check a license’s own text before relying on it.
License families by Black Duck risk class
| Black Duck risk class | Share your own source? | |
|---|---|---|
| MIT | Low | No |
| Apache 2.0 | Low | No |
| BSD 2 and 3-Clause | Low | No |
| LGPL and MPL 2.0 | Medium | For the covered files |
| GPL v2, GPL v3, AGPL | High | Yes, for derived works |
| License | Share of codebases (OSSRA 2026) | Black Duck risk class |
|---|---|---|
| MIT | 92% | Low |
| Apache 2.0 | 90% | Low |
| BSD 3-Clause | 85% | Low |
| LGPL 2.1 or later | 48% | Medium |
| MPL 2.0 | 45% | Medium |
Source: Black Duck, 2026 OSSRA Report.
Each license brings different duties. The question is how common the risky ones are in what you ship. The chart plots each top-ten license by risk class and share of codebases. Positions on the horizontal axis are our placement by Black Duck’s class, not a measured score.
Figure 5: Share of codebases against Black Duck’s risk class. Source: Black Duck, 2026 OSSRA Report. Horizontal positions are illustrative.
The three most common licenses are also the lowest risk class, which is why they win.
How often do licenses collide or go missing?
68% of the 947 codebases in the 2026 OSSRA report had a license conflict, up from 56% in 2025, the highest rate in the report’s history. The mean was 104 conflicts per codebase, up from 69, and the median was 8, up from 5. One large Gradle project had 2,675 conflicts across 3,235 components.
Our open source growth data covers the 180 million developers feeding that pipeline, and our software licensing audit data shows what a compliance miss costs.
Missing licenses are a separate problem. Of components scanned, 78% used a standard recognized license, 11% used a custom or modified one, 8% had no license detected and 3% were dual or multiple licensed. Black Duck also found that 64% of open source components are transitive dependencies, so many of those licenses arrive without anyone choosing them.
Conflict rates varied by industry. Big Data, AI, BI and ML codebases hit 78%, EdTech 74%, Financial Services and FinTech 72% and Internet and Mobile Apps 71%. The lowest rates were aerospace, aviation, automotive and logistics at 52% and hardware and semiconductors at 54%.
Figure 6: A quick check before any new dependency lands. Source: process outline built on the OSSRA license status categories (Black Duck, 2026).
Black Duck’s own sample comes from audits tied to 197 M&A transactions, and Black Duck sells license scanning tools. Its numbers are the best public benchmark, but no equally large independent audit exists to cross-check them.
Most conflicts happen between two licenses inside one build. You can check for them.
How has license data changed since 2015?
The data sources differ in scope, so this timeline is a reading guide. Each entry is a snapshot from a different method and measures something different.
Figure 7: Where each license data source sits in time. Source: GitHub, OSI and Black Duck publications cited in this post.
Only the 2026 figure measures commercial codebases directly, so it carries the headline.
What this means for your EULA
Open source licenses cover the code you borrow. Your EULA covers the code you ship and what users may do with it. Most permissive licenses ask you to keep a copyright notice, so a short third-party notices section belongs in your terms or docs. People rarely read these documents anyway, as our analysis of how many people read EULAs shows, so clear, short terms matter. If you sell to larger buyers, enterprise software data shows how often they ask about third-party code. A EULA generator can give you a starting draft that you then adapt to your own product and review with a lawyer.
Check every license you use. Then write terms that match what you ship.
The Bottom Line
92% of commercial codebases contain MIT, 90% contain Apache 2.0 and 85% contain BSD 3-Clause. The top of the ranking is permissive. The mess underneath it is what grows. 68% of codebases now hold a license conflict, 8% of components have no license at all and 64% of components are transitive dependencies you did not pick.
For a site owner or software seller, the practical step is small. List the licenses in your product, flag anything copyleft, custom or missing, and keep the notices that permissive licenses ask for. Then make sure your own EULA does not promise users rights the code you borrowed does not give you. Run that check each time your dependency list changes, not once a year.
Frequently Asked Questions
What is the most used open source license? MIT. It appears in 92% of the 947 commercial codebases Black Duck scanned for its 2026 OSSRA report, ahead of Apache 2.0 at 90% and BSD 3-Clause at 85%.
How much of Maven and npm is MIT or Apache licensed? In a September 2023 ClearlyDefined snapshot, 53% of npm components were MIT and 69.18% of Maven components were Apache 2.0. Only 7.4% of Maven components were MIT.
How common are open source license conflicts? 68% of the 947 codebases in Black Duck’s 2026 OSSRA report had at least one license conflict, up from 56% in 2025. The median codebase had 8 conflicts and the mean was 104.
How many open source components have no license? 8% of components scanned for the 2026 OSSRA report had no license detected, and another 11% carried a custom or modified license. 78% used a standard recognized license.
Sources and References
- Black Duck: Open Source Security and Risk Analysis Report (2026). 947 codebases, 17 industries, November 2024 to October 2025. Top ten licenses, conflict rates, component license status.
- Open Source Initiative: Top Open Source licenses in 2025. Published December 17, 2025. Pageviews on OSI license pages via Plausible.
- Open Source Initiative: Top Open Source licenses in 2024. Published December 23, 2024.
- Open Source Initiative: The most popular licenses for each language in 2023. ClearlyDefined dataset from September 21, 2023. No sample sizes published.
- GitHub: Open source license usage on GitHub.com. Published 2015, updated December 2021. No sample size published.
Note: All figures verified as of November 2026. The OSSRA and OSI figures are annual, and the ClearlyDefined and GitHub figures are older snapshots, so headline numbers are refreshed at least twice a year.