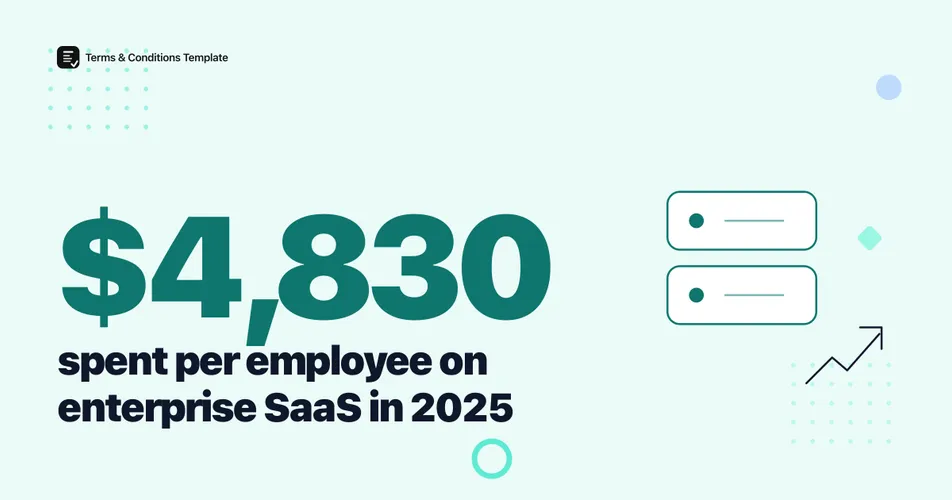
Enterprise software spend hit $4,830 per employee in 2025, up 21.9% year over year, according to Zylo’s 2025 SaaS Management Index, which tracked more than 40 million licenses and $40 billion in software spend across its customer base. That growth is not evenly spread across a company, and roughly half of every seat purchased goes unused once the invoice is paid.
If you sell, buy, or manage software seats, the numbers below explain why enterprise software budgets keep climbing even as utilization stays flat: spend concentrates outside IT, audits are becoming routine, and per-seat pricing has not gone away despite years of usage-based hype.
How much do companies spend on enterprise software per employee?
The average company now spends $4,830 per employee on SaaS software annually, up from a lower base in 2024, a 21.9% year-over-year jump, per Zylo’s 2025 SaaS Management Index. That growth rate outpaces the broader software market, which Gartner forecasts will reach $1.43 trillion worldwide in 2026, up 15.2% from 2025 and the fastest-growing category in Gartner’s IT spending model. A newer driver is stacking on top of both figures: spending on AI-native applications surged 75.2% year over year in Zylo’s dataset, a category that barely existed in enterprise budgets three years ago.
Figure 1: Growth rate comparison across three measures of enterprise software spend. Sources: Zylo 2025 SaaS Management Index; Gartner Worldwide IT Spending Forecast, October 2025.
None of these growth rates are slowing down heading into 2026. Budget owners are not buying fewer tools, they are buying pricier ones, and AI features are the fastest-growing line item inside an already-growing category.
How does enterprise software spend scale by company size?
Company size changes the math dramatically. Small companies with 1 to 500 employees spend about $11.5 million a year on SaaS and run 152 apps, while large enterprises with 10,000 or more employees spend $284 million a year and run 660 apps, according to Zylo’s 2025 Index. That is roughly a 25-fold jump in total spend for a company that is, at most, 20 times larger by headcount, meaning per-seat cost tends to climb rather than fall as an organization scales.
Figure 2: Annual SaaS spend by company size. Source: Zylo 2025 SaaS Management Index.
| Company size | Employees | Annual SaaS spend | Apps in use |
|---|---|---|---|
| All companies (average) | Any size | $4,830 per employee | 106 |
| Small business | 1 to 500 | $11.5 million | 152 |
| Large enterprise | 10,000+ | $284 million | 660 |
Bigger companies are not just spending more in absolute terms, they are running more apps per employee too, which is exactly the sprawl that turns into an audit or a seat-utilization problem next. The gap between a small business’s software stack and a 10,000-employee enterprise’s stack is not just a matter of more of the same tools bought in bulk. Larger organizations accumulate overlapping point solutions across regions, departments, and acquisitions, so the 660-app figure at the top end almost certainly includes duplicate categories that a smaller company never needed to solve twice. That accumulation is the direct precursor to the waste figures in the next section.
How much of enterprise software spend goes to waste on unused seats?
Software waste is not evenly distributed either. It concentrates wherever a purchase happened without a matching review cycle, which, given how much buying now happens outside IT, describes a large share of the enterprise software stack. Organizations use only about 49% of the software seats they provision, meaning roughly half the licenses a company pays for sit idle. That underuse translates into an average of $21 million a year in wasted SaaS spend, up 14.2% year over year, according to Zylo’s SaaS Management Index data. Waste is growing even as tools for tracking usage improve, largely because purchasing volume is growing faster than any single team’s ability to audit it.
Figure 3: Share of provisioned software seats actually in use. Source: Zylo SaaS Management Index.
A generator alone will not fix seat waste, but a clear EULA that spells out per-seat license terms, renewal notice periods, and what happens to unused seats at renewal gives a procurement or IT team a contractual hook to reclaim spend instead of auto-renewing blind.
Who actually controls enterprise software purchasing?
IT departments are no longer the primary buyer of enterprise software. Lines of business now account for 70% of SaaS spend, while IT is responsible for just 26.1%, according to Zylo’s 2025 Index. That split matters because decentralized buying is exactly what produces the seat sprawl and audit exposure described elsewhere in this post: a marketing team’s per-seat subscription rarely shows up in the same inventory as an IT-procured enterprise license.
Figure 4: Rough positioning of enterprise software categories by purchasing control and inventory visibility. Sources: Zylo 2025 SaaS Management Index; Flexera 2026 State of ITAM Report.
Only 36% of organizations report complete visibility into their IT estate, and another 62% report only partial visibility, according to Flexera’s 2026 State of ITAM Report, a survey of more than 500 IT asset management professionals. Decentralized buying and incomplete visibility are two sides of the same seat-management problem.
Are enterprise software audits and license compliance risk rising?
Audits are close to routine now. 48% of organizations were audited for software license compliance in the past year, and 44% spent more than $1 million on audits over the past three years, per Flexera’s 2026 State of ITAM Report. Microsoft is the most common auditor by a wide margin, named in 64% of audited organizations, ahead of every other vendor tracked in the survey.
Figure 5: The visibility gap between a purchased seat and an audit-ready inventory. Source: Flexera 2026 State of ITAM Report, 500+ ITAM professionals.
The gap between the 48% audit rate and the 36% full-visibility rate is the real risk: companies that cannot fully inventory their own seats are the ones most likely to fail an audit they cannot see coming. A related risk sits in the underlying agreements themselves. Reading and understanding what a EULA actually permits per seat matters more as audit frequency rises, and most employees never read the license terms that govern the seats they are using.
Are software seats still how enterprise vendors price in 2026?
Yes, seats have not gone away. More than 80% of SaaS companies use some form of seat-based pricing metric, according to Price Intelligently by SBI’s 2025 State of SaaS Pricing Report, a survey of 321 SaaS operators and executives. Only 8% rely on seats as their sole pricing metric, but 33% use seats as a primary metric alongside others and 37% use seats as a secondary metric, meaning the large majority of enterprise software contracts still reference a seat count somewhere in the pricing terms.
Figure 6: Enterprise software spend and seat-management milestones. Sources: BetterCloud/Zylo app-count data; Zylo SaaS Management Index; Gartner Worldwide IT Spending Forecast.
| Seat-pricing role | Share of SaaS companies |
|---|---|
| Secondary metric alongside others | 37% |
| Primary metric alongside others | 33% |
| No seat-based component at all | 22% |
| Sole pricing metric | 8% |
Even the components not counted as seat-based often reference license counts internally, and open source dependencies inside a vendor’s own product can complicate what a seat actually licenses. Companies tracking open source usage and license terms alongside their commercial software agreements get a fuller picture of what they are actually paying for per seat.
The Bottom Line
Enterprise software spend is rising faster than headcount, faster than the broader IT budget, and faster than most companies’ ability to track what they are actually buying. The $4,830-per-employee figure is the clearest single number for that trend, but the more actionable one is 49%: roughly half of every provisioned seat sits unused, and lines of business, not IT, control most of the purchasing decisions that create that waste. A documented, per-seat EULA does not fix procurement sprawl by itself, but it gives a company the contractual language to right-size license counts at renewal instead of auto-renewing an inventory nobody has fully audited. You can generate a clear EULA that spells out seat terms, renewal notice, and license scope in a few minutes.
Frequently Asked Questions
How much do companies spend on enterprise software per employee in 2026? Companies spent $4,830 per employee on SaaS software in 2025, up 21.9% year over year, according to Zylo’s 2025 SaaS Management Index, which tracked more than 40 million licenses and $40 billion in SaaS spend.
How does enterprise software spend scale by company size? Small companies with 1 to 500 employees spend about $11.5 million a year on SaaS and run 152 apps, while large enterprises with 10,000 or more employees spend $284 million a year and run 660 apps, according to Zylo’s 2025 SaaS Management Index.
What share of enterprise software licenses go unused? Organizations use only about 49% of the software seats they have provisioned, and waste an average of $21 million a year on unused licenses, up 14.2% year over year, according to Zylo’s SaaS Management Index data.
Are software seats still the dominant enterprise software pricing model in 2026? Yes. More than 80% of SaaS companies use some form of seat-based pricing, though only 8% rely on seats as their sole metric; 33% use seats as a primary metric and 37% as a secondary one, according to Price Intelligently by SBI’s 2025 State of SaaS Pricing Report (n=321 pricing leaders and operators).
Sources and References
- Zylo. (2025). “2025 SaaS Management Index.” Seventh annual edition; over 40 million SaaS licenses and $40 billion in tracked spend analyzed. Spend per employee, spend and app counts by company size, lines-of-business purchasing share, AI-native app spend growth.
- Zylo. (2024). “2024 SaaS Management Index.” Sixth annual edition; 30 million licenses and $34 billion in tracked spend analyzed. Seat utilization rate and unused-license waste baseline.
- Flexera. (2026). “State of ITAM Report: How Governance Gaps Are Driving Costly Software Audits.” Survey of 500+ IT asset management professionals.
- Gartner, Inc.. (2025). Worldwide IT Spending Forecast, presented at Gartner IT Symposium/Xpo, October 2025, analyst John-David Lovelock. Software segment: $1.43 trillion in 2026, up 15.2%.
- Price Intelligently by SBI. (2025). “2025 State of SaaS Pricing Report, Part 1: 10 Insights for Building Market-Leading Pricing.” Survey of 321 SaaS operators and executives. Seat-based pricing prevalence by role.
Note: All figures verified as of October 2026. Spend-per-employee and audit figures are current-year survey results subject to revision as newer editions publish; headline figures here are scheduled for refresh at least twice a year.