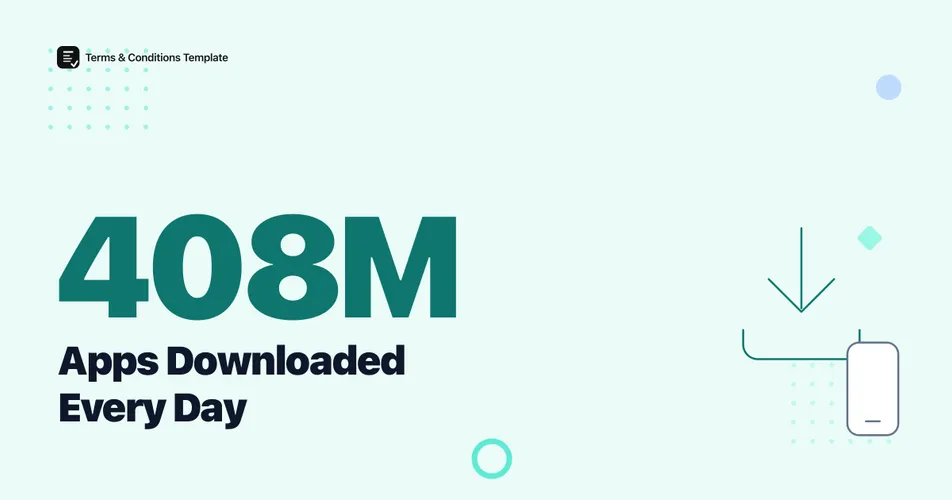
An average of 408 million apps were downloaded every day in 2025, based on Sensor Tower’s count of 149 billion combined Apple App Store and Google Play downloads for the year in its State of Mobile 2026 report, published January 21, 2026. Neither store publishes a live per-day download counter, so this daily figure is a calculation built on a real annual total, not a number either company reports directly.
That distinction matters if you are citing this figure. Below is how the daily average is built, how it has moved since 2023, and how it compares to the other daily rates that make up the app economy: new apps published, submissions rejected, and money spent.
How many apps are downloaded every day in 2026?
Dividing Sensor Tower’s 149 billion combined downloads for 2025 by 365 days gives an average of 408.2 million app downloads a day. That total spans the Apple App Store and Google Play only, the two stores Sensor Tower’s State of Mobile report tracks; it does not include third-party Android storefronts that operate outside Google Play in regions like China. The 149 billion figure itself comes from Sensor Tower’s own install-tracking panel and store-level data feeds, the same methodology the firm has used across its annual State of Mobile series.
Figure 1: Daily download average, calculated by dividing each year’s combined store total by 365. Source: Sensor Tower State of Mobile reports, 2024-2026 editions.
A daily average also smooths out real seasonal swings. Holiday-season device activations, major OS updates, and viral single-app launches all push actual daily downloads well above or below 408 million on any given day; the yearly total simply cannot show that variation.
How has the daily download average changed since 2023?
The daily average has moved with the underlying annual totals Sensor Tower reports each year: 131 billion downloads in 2023, 136 billion in 2024, and 149 billion in 2025. Turned into daily rates, that is a climb from 358.9 million a day to 372.6 million and then to 408.2 million, a 3.8% rise in the daily rate between 2023 and 2024 followed by a sharper 9.6% rise between 2024 and 2025.
Figure 2: Annual download totals behind the daily averages above. Source: Sensor Tower State of Mobile reports, 2024-2026 editions.
| Year | Annual downloads | Average per day | YoY change in daily rate |
|---|---|---|---|
| 2023 | 131 billion | 358.9 million | n/a (baseline) |
| 2024 | 136 billion | 372.6 million | +3.8% |
| 2025 | 149 billion | 408.2 million | +9.6% |
The daily rate did not just grow, it grew faster in the most recent year measured, which is the opposite of a plateau despite raw annual growth looking modest at a glance.
How many new apps get published every day?
Every one of those 408 million daily downloads pulls from a catalog that keeps expanding. Developers publish about 6,657 new apps every day across the two major stores combined, 4,009 on the Apple App Store and 2,648 on Google Play, according to 42matters’ live trackers measured July 25, 2026. Apple’s store adds new listings faster than Google Play does, a pattern our app developer count breakdown covers in more detail alongside how many active publisher accounts sit behind each store.
Figure 3: Share of new daily app listings by store. Source: 42matters live trackers, July 25, 2026.
Every one of those 6,657 daily listings needs licensing terms that match what the app actually does before it can be legally distributed. If you are one of today’s publishers, you can generate a EULA in a few minutes rather than reusing boilerplate written for a different app.
How many app submissions get rejected every day?
Not every submission behind those daily publishing numbers makes it live. Google rejected more than 1.75 million app submissions for policy violations across 2025, an average of roughly 4,795 rejected submissions a day, according to Google’s own security blog post published in February 2026. The company separately removed about 2 million previously published apps that same year, and Google Play Protect’s scanning layer checked over 350 billion apps daily across the wider Android ecosystem, a different and much larger figure than new-app submissions since it counts every scan of every installed app, not new listings.
Figure 4: How a submission becomes a counted download, with the daily rejection average from 2025 data. Source: Google Online Security Blog, February 2026.
Apple runs a comparable pre-publication review for the App Store but discloses less about it in raw numbers. Neither company breaks out how many of these daily rejections trace specifically to missing or mismatched legal terms such as a EULA, though both list incomplete app metadata and policy information among their published rejection reasons.
How much do people spend in apps every day?
The other daily figure worth tracking alongside downloads is spend. Consumers spent $167 billion inside apps in 2025, an average of about $457.5 million a day, up from $411.0 million a day in 2024, according to Sensor Tower. That is a faster daily growth rate for spending than for downloads, which means the average download is worth more to a publisher today than it was a year earlier. Our app store 2026 breakdown covers the full revenue split, including how non-gaming apps out-earned games for the first time in 2025.
| Metric | Daily figure (derived) | Annual source figure (2025) | Source |
|---|---|---|---|
| App downloads (Apple + Google Play) | 408.2 million | 149 billion | Sensor Tower |
| Consumer spend inside apps | $457.5 million | $167 billion | Sensor Tower |
| New apps published | 6,657 | Live daily rate | 42matters, Jul 25, 2026 |
| App submissions rejected | ~4,795 | 1.75 million+ | Google Security Blog |
Figure 5: When each daily figure in this article was reported, plotted against the year it measures. Sources: Sensor Tower, Google Online Security Blog, 42matters.
Every one of these daily rates measures a different stage of the same pipeline: submissions come in, a share get rejected, the rest get published, and a fraction of the resulting catalog gets downloaded 408 million times a day on average.
The Bottom Line
The 408 million figure is useful precisely because it is transparent about what it is: an annual total from a named source, divided by 365. It is not a live download counter, and no store publishes one. What the underlying data shows clearly is that the daily download rate grew faster between 2024 and 2025 than it did the year before, while the daily rate of new app publishing, app rejection, and consumer spending all moved in the same direction at once. If you are publishing into that pipeline, the practical takeaway is that review scrutiny on the roughly 6,657 new listings a day has not eased, and a EULA that does not match what your app currently does is one of the easier things a reviewer can flag.
Frequently Asked Questions
How many apps are downloaded every day? An average of 408 million apps are downloaded every day, based on Sensor Tower’s State of Mobile 2026 report, which counted 149 billion combined Apple App Store and Google Play downloads across all of 2025. Neither store publishes a live daily download counter, so this is a calculated average, not a real-time figure.
Has the daily download average been growing? Yes. The average rose from about 359 million downloads a day in 2023 to 373 million in 2024 and 408 million in 2025, a roughly 9.6% jump in the daily rate in a single year, per Sensor Tower’s State of Mobile reports.
How many new apps get published every day? About 6,657 new apps are published every day across the two major stores, 4,009 on the Apple App Store and 2,648 on Google Play, according to 42matters’ live trackers measured July 25, 2026.
How many app submissions does Google reject every day? Google rejected more than 1.75 million app submissions for policy violations in 2025, an average of roughly 4,795 rejected submissions a day, according to Google’s own security blog. The company separately removed about 2 million previously published apps that year.
Sources and References
- Sensor Tower. (2026). “State of Mobile 2026.” Global download and consumer spend data for 2025, published January 21, 2026.
- 42matters. “iOS Apple App Store Statistics and Trends.” Live tracker, data captured July 25, 2026.
- 42matters. “Google Play Statistics and Trends.” Live tracker, data captured July 25, 2026.
- Google Online Security Blog. (2026). “Keeping Google Play & Android app ecosystems safe in 2025.” Published February 2026.
Note: All figures verified as of August 2026. The daily download and spend averages are derived by dividing each year’s published annual total by 365; app-count and publishing-rate figures are live, third-party-tracked numbers that change daily. Headline figures here are refreshed at least twice a year.