Returns and refunds now consume 20% to 25% of revenue once reverse logistics, processing systems, customer support, and restocking are factored in, according to Seel’s 2025 State of Returns and Refunds Report, an analysis of 10 million transactions across thousands of merchants. That cost sits on top of the $849.9 billion in merchandise US retailers are expected to take back in 2025, per the National Retail Federation and Happy Returns. A return is never just a refunded sale, it is a second shipment, a quality check, and often a markdown, and the numbers below break down where that money actually goes.
None of this is solved by a shorter return window or a stricter policy alone. It is solved by understanding which part of the cost stack a merchant actually controls, fees, restocking, fraud screening, and which part is just the price of doing business online.
How much do returns cost retailers as a share of revenue?
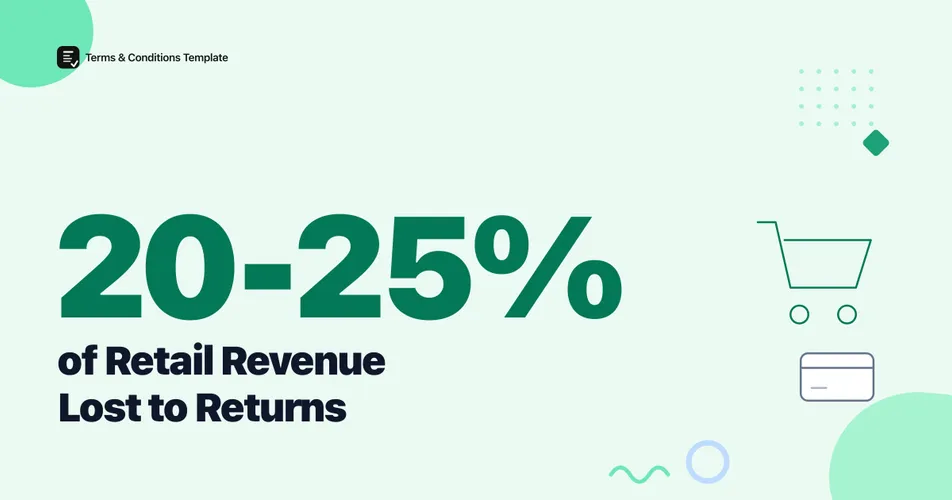
Seel’s 2025 State of Returns and Refunds Report puts the number at 20% to 25% of revenue, once a retailer counts reverse logistics, processing systems, customer support, and restocking operations rather than just the sticker price of the returned item. The report is built from an analysis of 10 million transactions across thousands of merchants during 2025, and it separately projects the total value of US retail returns in 2025 at roughly $1 trillion, a platform-data estimate that sits well above the NRF and Happy Returns’ survey-based figure of $849.9 billion for the same year.
Figure 1: Two separate 2025 estimates of total US retail returns value. Source: Seel, 2025 State of Returns and Refunds Report (10M+ transactions); National Retail Federation and Happy Returns, 2025 Retail Returns Landscape (survey of 2,006 consumers and 358 ecommerce professionals).
Warning
Seel’s $1 trillion figure and the NRF’s $849.9 billion figure are not measuring the same thing the same way. Seel extrapolates from its own platform’s transaction data across thousands of merchants, while the NRF projects a national total from a survey of consumers and ecommerce professionals. Treat both as directional estimates of the same rough magnitude, not as a single reconciled national number.
The revenue-share framing matters more than the dollar total for most merchants, because it scales to a business of any size. A retailer doing $2 million a year in sales is plausibly losing $400,000 to $500,000 annually to the full cost of returns, not just the value of the goods that came back.
What does it actually cost to process a single return?
Per-item processing cost is where the data gets shakier. The most widely repeated figure, that processing a return costs a retailer 66% of the item’s price, traces back to an estimate from reverse logistics company Optoro, cited in Coresight Research’s 2023 apparel returns study. Neither Optoro nor Coresight has published a year or methodology for how that 66% figure was calculated, so it should be read as an order-of-magnitude estimate rather than a current, precise benchmark.
Warning
The 66% figure is undated and its methodology is not disclosed, which puts it below the confidence bar for a headline claim in this article. We include it because it is the most-cited number in this space and because Coresight independently applied it to derive a $25.1 billion apparel processing-cost estimate for 2023, giving it at least one traceable hop back to a named source. Do not treat 66% as a current, audited figure.
Applied loosely to Seel’s own data, where the average returned item sells for $100 to $200, that 66% estimate implies a processing cost of roughly $66 to $132 per return, covering return shipping, inspection, repackaging, and the markdown a retailer typically eats when a once-opened item can no longer sell at full price.
Figure 2: The reverse-logistics branch point that decides whether a return costs a fraction of Optoro’s 66% estimate or the full amount. Source: synthesized from common reverse-logistics workflows described by Optoro and Coresight Research (2023).
Which branch a returned item lands on is the real variable behind the cost, not the return itself. A clear condition-of-return clause, stated in a published refund policy, is what gives staff a documented basis to route an item toward resale rather than automatically writing it off.
Why are more retailers charging a return fee?
Retailers are not absorbing the rising cost quietly anymore. 40% of ecommerce professionals cite rising costs of return-processing operations as a reason they now charge a return fee, tied exactly with rising carrier shipping costs at 40%, and 33% point to economic uncertainty and tariff risk, according to the National Retail Federation’s 2025 survey of 358 ecommerce professionals at large US merchants.
Figure 3: Top reasons ecommerce professionals give for charging a return fee. Source: National Retail Federation, 2025 Retail Returns Landscape, survey of 358 ecommerce professionals.
The fee itself has become a real, measurable line item. 65.2% of merchants now charge a return fee on at least some outcomes, with an average fee of $9.04, according to Loop Returns’ 2026 Global Ecommerce Report, an analysis of 23.4 million returns across more than 4,000 Shopify merchants collected between November 2024 and October 2025. The same report found 73.6% of merchants offer exchanges as an alternative to a refund, and the average refund decision window sits at 39 days. A return fee only offsets part of the processing cost above, it is not designed to cover the full 20% to 25% revenue hit, but it is one of the few controllable levers a merchant has. Our Refund Policy Generator builds a policy that states the fee, the window, and the condition requirements clearly, so shoppers see the terms before they buy rather than at the return step.
How much does return fraud add to the cost?
Fraud is a smaller but sharper slice of the cost stack. 11.4% of return value was flagged as high risk in Loop Returns’ 2026 report, with an average fraudulent return valued at $120, drawn from the same 23.4-million-return dataset above. Separately, the National Retail Federation’s 2025 survey put fraudulent returns at 9% of all returns industry-wide, a different measurement base than Loop’s flagged-value figure, so the two numbers should not be added together.
Figure 4: Share of total return value flagged high risk versus standard. Source: Loop Returns, 2026 Global Ecommerce Report, 23.4 million returns across 4,000+ Shopify merchants.
Wardrobing, receipt fraud, and returning counterfeit goods for genuine merchandise remain the recurring patterns behind that flagged share. A specific, published condition-of-return clause gives staff a documented reason to deny a suspicious return rather than defaulting to a refund to avoid a dispute.
Does the cost vary by product category?
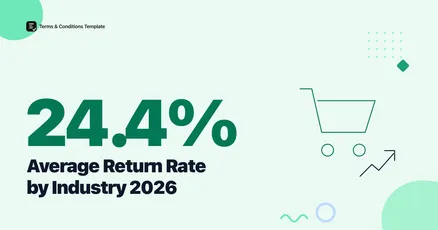
Category decides most of the cost variation. Apparel and footwear return online at 24.4%, the highest documented industry average, according to Coresight Research’s 2023 survey, nearly five points above the 19.3% blended online rate the NRF and Happy Returns measured in 2025. Our average return rate by industry post breaks that gap down further by vertical, and our ecommerce return rate benchmarks post covers the blended rate and its year-over-year trend in more depth.
| Category | Typical online return rate | Cost driver |
|---|---|---|
| Apparel and footwear | 24.4% (Coresight, 2023) | High volume, fit-driven, frequent markdowns |
| All online orders (blended) | 19.3% (NRF/Happy Returns, 2025) | Baseline across categories |
| Electronics | 8% to 15% (industry estimates) | Lower volume, higher per-unit repackaging cost |
| In-store purchases | 10.02% (NRF/Appriss, 2023) | Lowest reverse-shipping cost of any channel |
A high return rate and a high cost per return are not the same problem. Apparel drives cost mainly through volume, while a lower-volume category like electronics can still carry a heavy per-unit processing cost once testing and recertification are involved.
Figure 5: Illustrative positioning of return rate against estimated cost impact by category, synthesized from NRF/Happy Returns return-rate benchmarks and Coresight Research’s apparel cost analysis. Not a single measured dataset, treat as directional.
How do the different return-cost estimates compare?
Four separate organizations measure the cost of returns four different ways, and none of them are directly interchangeable. Knowing which figure applies to which question matters more than picking a single number to repeat.
| Metric | Figure | Source (year) | Scope |
|---|---|---|---|
| Cost as share of revenue | 20% to 25% | Seel (2025) | Reverse logistics, processing, support, restocking; 10M+ transactions |
| Cost to process one item | Up to 66% of item price | Optoro, cited via Coresight (2023) | Undated estimate, directional only |
| Total US retail returns value | $849.9 billion | NRF / Happy Returns (2025) | National survey-based projection |
| Average return fee charged | $9.04 | Loop Returns (2026) | 23.4M returns, 4,000+ Shopify merchants |
The cost-tracking landscape has moved fast enough in the last three years that a single citation from 2023 is already dated for anything except the per-item percentage, which nobody has since refreshed with a disclosed methodology.
Figure 6: Timeline of the primary reports behind the cost estimates in this article. Sources: Coresight Research (2023), Seel (2025), National Retail Federation and Happy Returns (2025), Loop Returns (2026).
The Bottom Line
The number worth remembering in 2026 is 20% to 25% of revenue, the share Seel’s transaction data attributes to the full cost of returns once reverse logistics, processing, support, and restocking are counted, not just the value of the goods sent back. That range sits alongside a nearly $850 billion national total, a per-item processing estimate that is still the industry’s best guess rather than a fresh audited figure, and a return-fee trend that shows retailers actively trying to claw part of that cost back from shoppers. None of the individual levers, a return fee, a tighter condition clause, faster fraud screening, closes the full gap on its own, but a clearly published refund policy that states the window, the fee, and the condition requirements up front is one of the few places a merchant controls the outcome directly rather than absorbing whatever the reverse-logistics chain hands back.
Frequently Asked Questions
How much do returns cost retailers as a share of revenue? Returns and refunds consume 20% to 25% of revenue once reverse logistics, processing systems, customer support, and restocking are included, according to Seel’s 2025 State of Returns and Refunds Report, an analysis of 10 million transactions across thousands of merchants.
How much does it cost to process a single return? Processing a single return can cost as much as 66% of the item’s price, according to a widely cited estimate from reverse logistics company Optoro. Optoro has not published the underlying methodology or year for that figure, so treat it as directional rather than a precise, current benchmark.
Why are more retailers charging a return fee? 40% of ecommerce professionals cite rising costs of return-processing operations as a reason they now charge for returns, tied with rising carrier shipping costs at 40%, according to the National Retail Federation’s 2025 survey of 358 ecommerce professionals at large US merchants.
How much does return fraud add to the cost? 11.4% of return value was flagged as high risk in Loop Returns’ 2026 Global Ecommerce Report, an analysis of 23.4 million returns across more than 4,000 Shopify merchants, with an average fraudulent return valued at $120.
Sources and References
- Seel. (2025). “2025 State of Returns and Refunds Report.” Analysis of 10 million transactions across thousands of merchants.
- National Retail Federation and Happy Returns. (2025). “2025 Retail Returns Landscape.” Survey of 2,006 consumers and 358 ecommerce professionals at US retailers with over $500 million in revenue, conducted summer 2025.
- National Retail Federation. (2025). “Consumers Expected to Return Nearly $850 Billion in Merchandise in 2025.” Press release, October 2025.
- Loop Returns. (2026). “2026 Global Ecommerce Report: Retention Benchmarks.” Analysis of 23.4 million returns across 4,000+ Shopify merchants, November 2024 to October 2025.
- Coresight Research. (2023). “The True Cost of Apparel Returns.” Cites Optoro’s estimate that processing a return costs 66% of the item’s price.
Note: All figures verified as of August 2026. Return-cost estimates shift with survey methodology, holiday seasonality, and reporting-vendor changes, so headline figures here are refreshed at least twice a year.