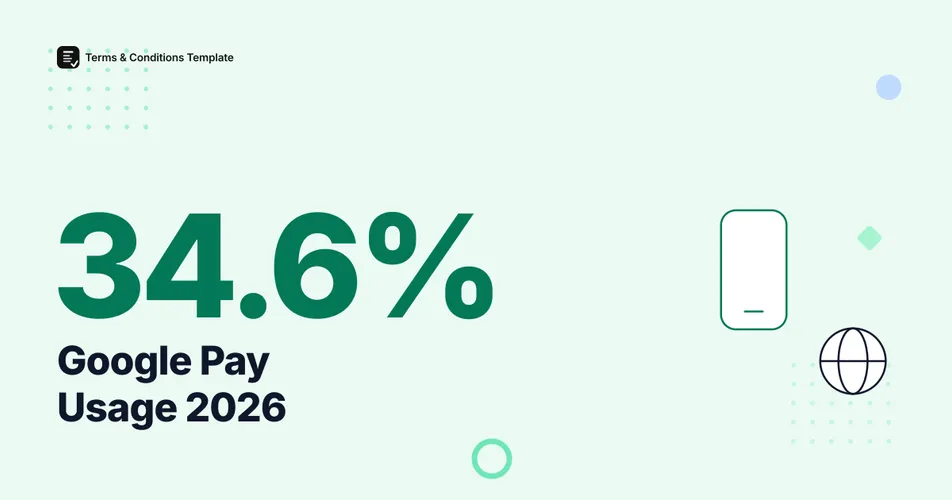
Google Pay processed 34.6% of India’s UPI transaction volume in July 2026, according to the National Payments Corporation of India’s published monthly data, making India by far its largest and most active market. Globally, Google does not disclose one official user count, so the clearest current picture comes from Worldpay’s Global Payments Report 2026, which puts Google Pay’s estimated worldwide user base at 150 to 250 million, a fraction of Apple Pay’s roughly 900 million estimated users.
How big is Google Pay in its largest market, India?
Figure 1: Google Pay’s share of India’s UPI transaction volume, July 2026. Source: NPCI monthly UPI app-wise data.
India runs on UPI, the government-backed instant payment rail, and Google Pay is one of only two apps that matter at scale there. NPCI’s own published data put Google Pay at 34.6% of UPI transaction volume in July 2026, up slightly from 32.75% in May 2026. PhonePe, the Walmart-backed market leader, held a larger 45.5% share the same month. This is rolling, monthly-published data rather than a fixed annual figure, so treat any single month’s split as a snapshot, not a settled number.
Figure 2: India’s UPI market share by app, July 2026. Source: NPCI monthly data, secondary reporting via Business Standard and Outlook Business.
Together, Google Pay and PhonePe process roughly 80% of every UPI transaction in the country, a duopoly so pronounced that India’s payments regulator proposed capping any single app at 30% of transaction volume. That cap has been repeatedly delayed and is now not scheduled to take effect until the end of December 2026, so for the moment the two-app dominance remains intact even as smaller apps like Navi, super.money, and BHIM slowly chip away at the edges.
How does Google Pay’s US and global reach compare?
Outside India, Google Pay’s footprint looks very different. Worldpay’s Global Payments Report 2026 estimates Google Pay’s worldwide user base at 150 to 250 million, against roughly 900 million estimated users for Apple Pay, a gap wide enough that Google Pay operates as a distant second in most markets outside South Asia.
Figure 3: Estimated global digital wallet users, in millions. Source: Worldpay Global Payments Report 2026 (estimates; Google does not publish an official global user count).
Warning
Google itself has never published a precise global user total for Google Pay or Google Wallet. The 150 to 250 million range above is Worldpay’s own estimate, and older third-party figures citing 150 million or 36 million active users refer to different years and different product scopes (some count only the standalone Google Pay app before it merged into Google Wallet in the US in February 2024), so they are not comparable to the current estimate.
In the US specifically, 17% of consumers use Google Wallet, compared with 34% who use Apple Pay, according to the same Worldpay report; 28% of US consumers name Apple Pay their primary digital wallet. Google confirmed in a February 2024 blog post that it was folding the standalone Google Pay app into Google Wallet for US users, simplifying two overlapping apps into one, which likely explains part of the gap between older Google Pay-specific figures and the current Google Wallet numbers.
How does digital wallet usage vary by region?
Digital wallets overall, not just Google Pay, processed 56% of global ecommerce value in 2025, per Worldpay’s Global Payments Report 2026. That average hides an enormous regional spread: wallets dominate checkout in Asia far more than in the West.
Figure 4: Digital wallet share of ecommerce transaction value by region, 2025. Source: Worldpay Global Payments Report 2026.
China’s Alipay and WeChat Pay combine for 89% of the country’s ecommerce value, and India’s UPI ecosystem, where Google Pay competes directly with PhonePe, covers 68% of online spend. The United States trails every other major region in the report at 40%, meaning American checkout pages still lean more heavily on cards than anywhere else covered here. That gap is also visible in mobile commerce data, where wallet-first markets convert a larger share of mobile traffic into completed sales than card-first ones like the US.
What has changed for Google Pay recently?
Figure 5: Google Pay and Google Wallet product and policy milestones. Source: Google’s official blog; NPCI regulatory proposals.
The throughline across these changes is consolidation, fewer overlapping apps in the US, and a regulatory fight in India over whether two apps should be allowed to carry 80% of the country’s instant payments indefinitely. Neither change affects how a purchase made with Google Pay actually gets refunded; that still runs through the underlying card network or bank rail. See our refund speed data for how long that typically takes, and pair any checkout that accepts Google Pay with a Refund Policy Generator that states your refund timeline clearly regardless of which wallet a customer paid with.
How does Google Pay compare with other wallets and payment methods overall?
| Wallet | Est. global users | Primary market | 2026 share |
|---|---|---|---|
| Apple Pay | ~900M (estimated) | United States | 34% of US consumers use it |
| Google Pay / Wallet | 150-250M (estimated) | India | 34.6% of India’s UPI volume, July 2026 |
| PhonePe | Not publicly disclosed | India | 45.5% of India’s UPI volume, July 2026 |
| Paytm | Not publicly disclosed | India | 7.9% of India’s UPI volume, May 2026 |
Source: Worldpay Global Payments Report 2026; NPCI monthly UPI data. A broader look at how wallets and cards split checkout volume generally is in our mobile wallet statistics, contactless payment data, and digital payment statistics for 2026.
The Bottom Line
Google Pay’s story in 2026 is really two different stories depending on the market. In India it is a near-duopoly participant processing over a third of every UPI transaction, second only to PhonePe, and facing a regulator actively trying to break that dominance up. Everywhere else, most visibly the US, it is a distant number two behind Apple Pay, used by 17% of consumers against Apple Pay’s 34%. Any business accepting Google Pay needs to know which of those two realities its customers live in, since usage rates, and the checkout expectations that come with them, differ by an order of magnitude between the two.
Frequently Asked Questions
How many people use Google Pay? Google does not publish one global user count, but Worldpay’s Global Payments Report 2026 estimates 150 to 250 million global users, well behind Apple Pay’s roughly 900 million estimated users. In its largest market, India, Google Pay processed 34.6% of all UPI transaction volume in July 2026, per NPCI’s published monthly data.
What percentage of US consumers use Google Pay? 17% of US consumers use Google Wallet, compared with 34% who use Apple Pay, according to Worldpay’s Global Payments Report 2026.
Is Google Pay bigger than PhonePe in India? No. PhonePe led India’s UPI market with 45.5% of transaction volume in July 2026, ahead of Google Pay’s 34.6%, per NPCI data. Combined, the two process roughly 80% of all UPI transaction volume.
What happens with refunds on a Google Pay purchase? Google Pay is a payment method, not a merchant, so refunds are issued by the seller back through the same payment rail. Processing timelines follow the seller’s and card network’s refund rules rather than a Google-specific policy, typically a few business days to two weeks depending on the underlying card or bank account.
Sources and References
- Worldpay (Global Payments). (2026). “Global Payments Report 2026: Digital Wallets Trend.” Payment method share and user estimates across 42 markets.
- National Payments Corporation of India (NPCI). (2026). Monthly UPI app-wise transaction data, May and July 2026 snapshots.
- Google. (2024). “Simplifying our payment apps in the U.S.” Official Google blog, February 2024.
- Business Standard. (2026). Reporting on NPCI’s monthly UPI market share data.
Note: All figures verified as of August 2026. India’s UPI market share figures are rolling monthly data and are refreshed at least twice a year; global wallet estimates follow Worldpay’s annual Global Payments Report cycle.