
An estimated 59% of global ecommerce sales happened on a mobile device in 2025, according to aggregated market-size estimates from multiple ecommerce research firms, up from roughly 57% the year before. That share keeps climbing even though mobile checkout still loses more shoppers than desktop does at the final step. The gap between mobile’s growing share of traffic and its weaker conversion performance is the central tension in the 2026 mobile commerce numbers.
For a store owner, that tension has a practical edge: most first contact with your brand now happens on a phone screen, but the phone is also where the sale is most likely to fall apart. The data below breaks down where mobile commerce stands, where it is still losing shoppers, and what the trend line says about 2026 and beyond.
What percentage of ecommerce sales happen on mobile?
Global mobile ecommerce sales reached an estimated $2.51 trillion in 2025, representing about 59% of all ecommerce sales worldwide, based on aggregated estimates from ecommerce research and market-intelligence firms. That figure does not carry a single disclosed primary methodology; it is a market-size aggregate repeated and refined across several vendor reports, so it should be read as a directional consensus rather than an audited count.
The US figure is more conservative and better sourced. eMarketer estimated mobile commerce at 44.6% of US retail ecommerce sales in 2025, working out to roughly $728 billion in order value. That gap between the global estimate and the US-specific figure matters: mobile’s dominance is not uniform, and country-level context changes the picture considerably.
Figure 1: Mobile’s share of ecommerce sales, US versus global aggregate. Sources: eMarketer (US, 2025 estimate); aggregated ecommerce market-size reporting (global estimate).
That gap between a US figure near 45% and a global aggregate near 59% is explained by markets where mobile leapfrogged desktop entirely rather than following it, which the country comparison further down makes clear.
Why do mobile shoppers abandon carts more than desktop shoppers?
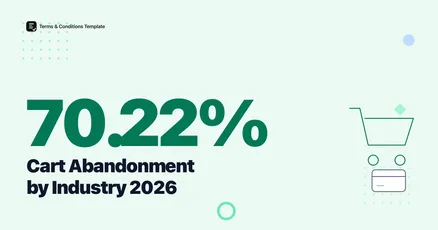
Mobile checkout loses more shoppers than any other device. Baymard Institute’s meta-analysis of 50 cart abandonment studies puts mobile abandonment at 80.02%, compared to 68.84% on tablet and 66.41% on desktop, for an overall blended average of 70.22% across all devices. This is the single most-cited abandonment benchmark in ecommerce because Baymard discloses its full study list and methodology rather than reporting a single proprietary panel.
The device gap has a simple explanation: smaller screens make label reading and form entry harder, autofill fails more often on mobile browsers, and trust signals like return policies and security badges get pushed below the fold. A checkout that requires several screens of scrolling to find the return window is a checkout that loses shoppers before they finish typing a card number.
Figure 2: Cart abandonment rate by device. Source: Baymard Institute, meta-analysis of 50 cart abandonment studies.
Publishing return and refund terms clearly, and early in the mobile checkout flow rather than buried in a footer link, is one of the few levers a merchant controls directly against this gap. A Refund Policy Generator that produces plain-language, mobile-readable terms removes one of the friction points Baymard’s underlying studies repeatedly flag.
Mobile carries the highest abandonment of any device by a wide margin, which means checkout friction, not shopper intent, is the more fixable half of the mobile commerce problem.
Do shopping apps convert better than mobile browser checkouts?
Yes, and the gap is large. A 2025 cross-industry benchmark analysis found retail app conversion rates run roughly 94% higher than mobile website conversion rates for the same retailers, with on-demand and travel apps showing even larger multiples in some categories. The exact multiple varies by report and by vertical, so treat any single number here as directional rather than a fixed constant across every store type.
Figure 3: Share of mobile time spent in apps versus mobile browsers. Source: aggregated mobile-usage reporting, 2025 estimate.
The mechanism is not mysterious. Apps skip repeated logins, remember payment details, and load faster than a mobile browser session rebuilding a page from scratch. For merchants without app budgets, the takeaway is not “build an app,” it is “remove the same friction an app removes”: fewer form fields, saved payment methods, and checkout terms that do not require pinch-zooming to read.
Apps outperform the mobile web by a wide margin, so a slow, form-heavy mobile checkout is competing against a channel that solved most of its own friction years ago.
Which countries lead in mobile-driven ecommerce?
Mobile’s share of ecommerce varies sharply by country. Secondary market-research estimates place mobile at roughly 64% of ecommerce transactions in China and roughly 80% in India, both well above the US figure of 44.6% reported by eMarketer. These regional splits do not come from a single harmonized primary dataset across countries, so treat the exact percentages as approximate rather than strictly comparable to the more rigorously sourced US number.
| Market | Mobile share of ecommerce (approx.) | Source type |
|---|---|---|
| India | ~80% | Aggregated market research |
| China | ~64% | Aggregated market research |
| Global (all markets) | ~59% | Aggregated market-size estimate |
| United States | 44.6% | eMarketer (2025 estimate) |
Markets that skipped a desktop-ecommerce era and moved straight to smartphone-first internet access, India and much of Southeast Asia among them, show the highest mobile shares. The US, with a longer desktop ecommerce history and higher average order values on desktop, shows a narrower gap.
Figure 4: Mobile’s share of global ecommerce sales over time. Source: aggregated ecommerce market-size reporting, historical and forecast estimates.
The US-versus-global gap is not closing because American shoppers dislike phones. It reflects a market that built its ecommerce infrastructure around desktop first and is migrating toward mobile from a different starting point than markets that never had a substantial desktop-commerce phase.
How does mobile traffic compare to mobile sales?
Mobile devices generated an estimated 62.23% of global web traffic by mid-2025, ahead of desktop at roughly 35% and tablet at roughly 2%, according to StatCounter-based traffic aggregates. That traffic share runs slightly ahead of mobile’s 59% share of actual sales, which is consistent with the higher mobile abandonment rate covered above: more browsing happens on mobile than buying does.
Figure 5: Global web traffic share by device. Source: StatCounter-based aggregate reporting, mid-2025.
The traffic-to-sales gap is a checkout problem more than a discovery problem. Shoppers arrive on mobile at a higher rate than they buy on mobile, which points back to the same abandonment gap Baymard’s data quantifies: the browsing happens on the phone, but the friction that stops the sale often happens there too.
The Bottom Line
Mobile commerce has crossed the point where it drives most global online sales, and the US is following the same direction even if it has not caught up yet. The real 2026 story is not the share number, it is the gap between mobile’s traffic share and its conversion performance: mobile carries more browsing and more abandonment than any other device, at 80.02% versus 66.41% on desktop. Merchants who treat mobile checkout as an afterthought are optimizing for the smaller half of their sales. Publishing clear, mobile-readable terms, especially the return and refund window shoppers look for right before they commit to a purchase, is one of the most direct ways to close that gap.
Frequently Asked Questions
What percentage of ecommerce sales happen on mobile? An estimated 59% of global ecommerce sales happened on mobile devices in 2025, based on market-size aggregates reported by multiple ecommerce research firms. In the United States specifically, mobile accounted for a narrower 44.6% of retail ecommerce sales in 2025, according to eMarketer estimates.
Why do mobile shoppers abandon carts more than desktop shoppers? Mobile cart abandonment sits at 80.02% versus 66.41% on desktop and 68.84% on tablet, according to Baymard Institute’s meta-analysis of 50 cart abandonment studies. Smaller screens, more checkout friction, and slower form entry are the most commonly cited causes.
Do shopping apps convert better than mobile browser checkouts? Yes. Retail app conversion rates run roughly 94% higher than mobile website conversion rates for the same retailers, according to a 2025 cross-industry benchmark analysis, though the exact multiple varies by report and industry.
Which countries have the highest share of mobile-driven ecommerce? China and India report the highest mobile ecommerce shares, with secondary market estimates placing mobile at roughly 64% of Chinese ecommerce transactions and roughly 80% in India, well above the US figure of 44.6%.
Sources and References
- eMarketer. (2025). “US Ecommerce Forecast 2025.” US mobile commerce share estimate, 44.6% of retail ecommerce sales.
- Baymard Institute. (2026). “50 Cart Abandonment Rate Statistics.” Meta-analysis of 50 published cart abandonment studies, broken out by device.
- Statista. “U.S. m-commerce share of total retail sales.” Historical and forecast US mobile commerce share.
- Statista. “Global m-commerce revenue and share in e-commerce, 2017-2028.” Worldwide mobile commerce revenue and share estimates.
- StatCounter. (2025). “Desktop vs Mobile vs Tablet Market Share Worldwide.” Global device traffic share.
Note: All figures verified as of July 2026. Global mobile-share and app-versus-web conversion figures are drawn from aggregated market research without a single disclosed harmonized methodology and should be treated as directional; the Baymard cart-abandonment figures and the eMarketer US share figure carry disclosed methodology and are the more reliable numbers in this article. Headline figures are refreshed at least twice a year.

![19.3% of Online Orders Are Returned: 2026 [Benchmarks]](/_astro/ecommerce-return-rate-statistics-2026.CZg1x-y__1IyODE.webp)


![$738.82B Subscription Economy 2026 [Market Data]](/_astro/subscription-economy-statistics-2026.DlJyP-Sz_1lQ00z.webp)