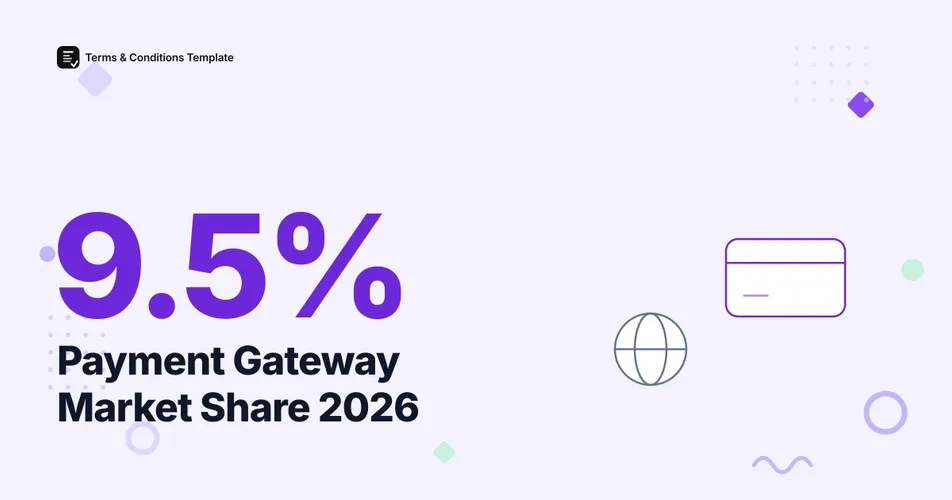
PayPal holds the largest single share of the global payment gateway market at 9.5% in 2025, according to Global Market Insights’ April 2026 report, yet the top 5 providers combined control only 38.8% of a market GMI values at $32.7 billion. No single company comes close to a majority, and the gap between “market share” and “dollar volume processed” turns out to be one of the more useful things a store owner can understand before choosing a checkout provider.
If you run a store or a marketplace, this matters beyond trivia. The gateway you pick determines your dispute process, your PCI scope, and what your terms and conditions need to say about how refunds and chargebacks actually work. Here is what the 2026 data shows, provider by provider.
Who leads the payment gateway market in 2026?
PayPal is the single largest provider at 9.5% market share in 2025, according to Global Market Insights’ payment gateway market report, published April 2026. The next four largest providers, Block (Square), FIS Global, Fiserv, and Stripe, bring the combined top 5 total to just 38.8%. That leaves 61.2% of the market spread across smaller regional processors, vertical-specific gateways, and bank-owned platforms that individually hold a sliver of share each.
Figure 1: 2025 global payment gateway market share. Source: Global Market Insights, April 2026.
This fragmentation is a market-structure story, not a popularity contest. GMI’s share figures measure gateway software and services revenue, which rewards breadth of merchant relationships over transaction size. A provider can lead this list while moving less raw dollar volume than a competitor with a smaller share, and that is exactly what happens further down this page.
How big is the payment gateway market in 2026?
The global payment gateway market is projected to reach $35.6 billion in 2026, up from $32.7 billion in 2025, according to Global Market Insights. GMI forecasts the market will keep expanding to $116.7 billion by 2035, a 14.1% compound annual growth rate across that stretch. North America is the largest single region at $11.5 billion in 2025, Europe holds a 24.5% share of global revenue, and Asia Pacific is the fastest-growing region at a projected 16.6% CAGR through 2035.
Figure 2: Payment gateway market size and company reporting milestones, 2025 to 2035. Source: Global Market Insights, company earnings releases.
Growth at this pace outruns most retail categories, which is consistent with more of global commerce moving online and more merchants adding a second or third payment option at checkout rather than relying on one processor alone.
How does market share compare to the dollar volume each platform actually moves?
Market share and processed volume tell different stories, and the gap is the most useful number in this entire dataset. Stripe processed $1.9 trillion in total volume during 2025, a 34% increase over 2024, according to its own annual letter published in February 2026. PayPal’s official PayPal statistics show $1.79 trillion in total payment volume for the same year, from the company’s Q4/FY2025 earnings release. Adyen reported 1.39 trillion euros processed for full-year 2025, and Block’s Square channel processed $250.5 billion in gross payment volume over the same period.
Figure 3: Total volume processed in 2025, by platform. Sources: Stripe 2025 annual letter, PayPal Q4/FY2025 earnings, Block FY2025 earnings.
None of these four companies publishes an audited “gateway market share” percentage of its own. GMI’s 9.5% and 38.8% figures come from a market-research estimate of gateway software and services revenue, not raw payment volume, which is exactly why PayPal can rank first in GMI’s share table while moving less dollar volume than Stripe. Revenue share and transaction share answer different questions, and neither one alone is the whole picture.
Hosted or non-hosted, enterprise or SMB: which model dominates?
Hosted payment gateways, where the checkout page itself lives on the provider’s domain, account for 52.3% of the 2025 market, worth $17.1 billion, according to Global Market Insights. That leaves the remaining share to non-hosted and API-based integrations, where the merchant’s own site collects card details before handing them to the processor. Cards remain the leading payment method segment at 47% of 2025 market revenue ($15.4 billion), ahead of digital wallets, bank transfers, and buy now, pay later combined. Large enterprises make up 56.6% of gateway buyers in GMI’s data, outweighing small and midsize businesses as a purchasing segment even though SMBs vastly outnumber enterprises by count of businesses.
Figure 4: A simplified decision path between hosted and non-hosted gateways. Source: Global Market Insights segment data, 2025.
The practical read for a merchant is that the two biggest structural choices, hosted versus non-hosted and enterprise versus standard tier, both favor the option with less setup complexity. That is also the option most likely to require the least custom language in a store’s own terms and conditions, since the provider’s own hosted page absorbs more of the checkout liability.
How many companies actually use each gateway?
Market-share percentages describe revenue, but a separate technographic dataset describes adoption directly. Datanyze’s technology-adoption tracker, which scans live websites for detectable payment integrations, shows PayPal installed on roughly 703,000 company websites, compared with about 327,000 for Stripe, 17,000 for PayPal Braintree, and 10,000 for Square, as of August 2026.
Warning
Datanyze does not publish a disclosed sample size or a fixed as-of date for these counts; the figures reflect its live, continuously updated technographic dataset rather than a dated survey. Treat them as directional adoption signals, not a precise market-share percentage, and note that a website can run more than one gateway at once, so these counts are not mutually exclusive shares of one pie.
This adoption gap helps explain why cards and digital checkout keep gaining share even as the overall mix of how people pay keeps shifting; see our cash vs card data for how that broader shift looks across all payment types, not just gateways. A processor installed on hundreds of thousands of storefronts accumulates dispute-handling experience and brand recognition that a smaller, higher-revenue-per-merchant competitor cannot match as quickly.
Provider comparison: share, volume, and growth
| Provider | 2025 Volume Processed | YoY Growth | Reporting Currency |
|---|---|---|---|
| Stripe | $1.9 trillion | +34% | USD |
| PayPal | $1.79 trillion | +7% | USD |
| Adyen | 1.39 trillion euros | +8% (+21% ex. one large customer) | EUR |
| Block (Square channel) | $250.5 billion | +10% | USD |
Table 1: Full-year 2025 volume processed by platform, as reported in each company’s own earnings materials. Adyen’s headline growth rate reflects the loss of one large-volume customer during the year.
| Market position | 2025 Market Share (GMI) |
|---|---|
| PayPal (largest single provider) | 9.5% |
| Other top 5 providers combined (Block, FIS Global, Fiserv, Stripe) | 29.3% |
| Rest of the market | 61.2% |
Table 2: Global payment gateway market share by provider tier. Source: Global Market Insights, April 2026.
The Bottom Line
Two different numbers answer two different questions here. Global Market Insights’ 9.5% and 38.8% figures describe how gateway software and services revenue splits across providers, and by that measure the market is genuinely fragmented, with no single company anywhere near a majority. Company-reported total payment volume tells a more concentrated story: Stripe, PayPal, Adyen, and Block together move well over $5 trillion a year between them. Whichever provider or providers a store settles on, the practical follow-up is making sure the store’s own legal documents actually name that relationship. A T&C Generator lets a merchant spell out which payment processor handles a transaction, how disputes route, and what happens if a gateway itself goes down mid-checkout, details that a generic template rarely covers.
Frequently Asked Questions
What is the largest payment gateway by market share in 2026? PayPal holds the largest single share at 9.5% of the global payment gateway market in 2025, according to Global Market Insights’ April 2026 report. The top 5 providers, Block (Square), FIS Global, Fiserv, PayPal, and Stripe, together control just 38.8% of the market.
How big is the payment gateway market in 2026? The global payment gateway market is projected to reach $35.6 billion in 2026, up from $32.7 billion in 2025, and is forecast to hit $116.7 billion by 2035 at a 14.1% compound annual growth rate, per Global Market Insights.
How much money moved through Stripe and PayPal in 2025? Stripe processed $1.9 trillion in total volume during 2025, according to its own annual letter published in February 2026. PayPal reported $1.79 trillion in total payment volume for the same year in its Q4/FY2025 earnings release, also published in February 2026.
Do hosted or non-hosted payment gateways dominate the market? Hosted payment gateways account for 52.3% of the 2025 market, worth $17.1 billion, versus non-hosted and API-based integrations for the rest, according to Global Market Insights. Large enterprises make up 56.6% of buyers in the same report.
Sources and References
- Global Market Insights. (2026). “Payment Gateway Market Size, Growth Analysis.” Report updated April 2026. Market size, provider share, segment, and regional figures.
- Stripe. (2026). “Stripe’s 2025 Annual Letter.” Published February 2026. Company-disclosed total payment volume.
- PayPal Holdings, Inc.. (2026). Q4 and Full-Year 2025 Earnings Release, filed with the SEC. Official total payment volume and transaction data.
- Adyen N.V.. (2026). “Adyen Publishes H2 2025 Financial Results.” Full-year 2025 processed volume, official investor release.
- Block, Inc.. (2026). Q4 and Full-Year 2025 Earnings Release, filed with the SEC. Square gross payment volume.
- Datanyze. Payment Processing Market Share and Competitor Report. Live technographic dataset, accessed August 2026.
Note: All figures verified as of August 2026. Company-reported volume figures are refreshed each quarter and market-size estimates are refreshed at least twice a year, so headline figures here are re-checked on the same cadence.