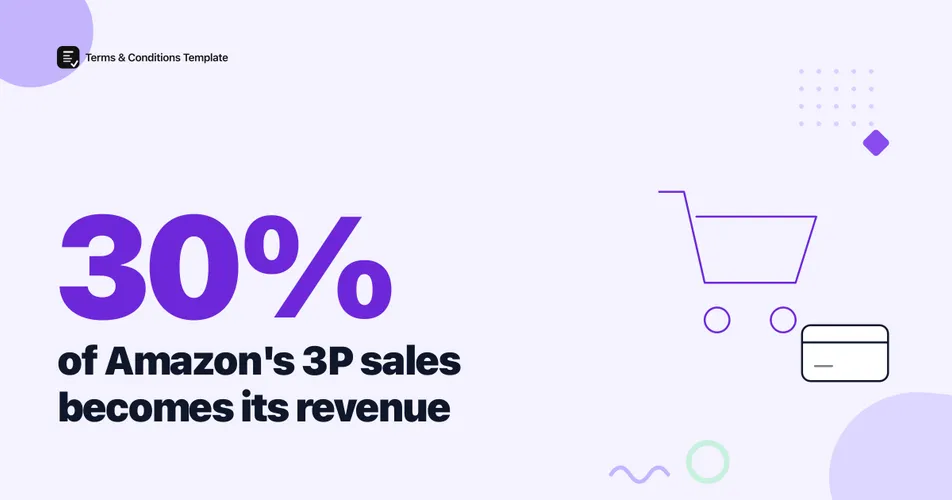
Amazon collected an estimated 30% of every dollar sold through its third-party marketplace in 2025, weighing its own disclosed seller-services revenue against Marketplace Pulse’s independent estimate of third-party gross merchandise value (GMV). Amazon’s SEC filings put third-party seller services revenue, the commissions, fulfillment fees, and other charges it collects from outside sellers, at $172.2 billion for the year, against an estimated $575 billion in third-party GMV.
That gap between GMV and collected revenue is the least-understood number in Amazon’s marketplace business, because the two figures come from different places: one is a hard number from a public company’s audited filings, the other is a third-party analyst’s estimate of total sales volume Amazon itself does not publish. Here is the 2026 data on what Amazon’s marketplace actually generates, how that splits against its own first-party retail sales, and where the real transparency gaps still sit.
How much revenue does Amazon collect from its marketplace?
Amazon’s third-party seller services segment, covering referral commissions, FBA fulfillment and storage fees, and other seller charges, generated $172.2 billion in 2025, up from $156.1 billion in 2024. That is a 10.3% year-over-year increase and the fifth straight year of growth for the segment, according to Amazon’s own SEC filings as compiled by StockAnalysis.com.
| Revenue line | 2024 | 2025 | YoY growth |
|---|---|---|---|
| Third-party seller services (3P) | $156.1B | $172.2B | +10.3% |
| Online stores (1P) | $247.0B | $269.3B | +9.0% |
| Combined retail revenue | $403.1B | $441.5B | +9.5% |
Source: Amazon.com, Inc. SEC filings, fiscal years 2024 and 2025, as compiled by StockAnalysis.com.
This is a disclosed revenue figure, not a sales-volume figure. Amazon collects it as fees on top of whatever price a third-party seller actually charges a customer, which is why it reads so differently from the marketplace’s total transaction value. For the seller-count and market-share context behind this number, see our Amazon seller and market share data for 2026.
What is the difference between marketplace GMV and Amazon’s collected revenue?
GMV measures the total dollar value of everything sold through Amazon’s third-party marketplace before Amazon takes its cut. Amazon’s collected revenue measures only what Amazon itself keeps: referral commissions, fulfillment fees, storage charges, and optional services like advertising. Marketplace Pulse estimates Amazon’s total marketplace GMV surpassed $800 billion in 2025, with third-party sellers responsible for 69% of it, or roughly $575 billion.
Figure 1: Amazon’s estimated take rate, calculated as disclosed third-party seller services revenue divided by Marketplace Pulse’s estimated third-party GMV. Source: Amazon SEC filings; Marketplace Pulse, 2026.
Warning
Treat the 30% take-rate figure as a derived estimate, not an Amazon-disclosed number. It combines a hard figure from Amazon’s own SEC filings ($172.2 billion in third-party seller services revenue) with Marketplace Pulse’s independent estimate of third-party GMV ($575 billion), which Amazon itself does not publish or confirm. The true figure could sit a few points either side of 30% depending on how GMV is modeled.
Dividing $172.2 billion in collected revenue by an estimated $575 billion in third-party GMV puts Amazon’s effective take rate at roughly 30% in 2025. Every dollar a third-party seller rings up on Amazon, Amazon keeps close to 30 cents of it before the seller pays for inventory, shipping to Amazon’s warehouses, or anything else.
| Metric | 2025 value | Source |
|---|---|---|
| Third-party GMV (estimated) | $575B | Marketplace Pulse |
| Amazon’s collected seller-services revenue | $172.2B | Amazon SEC filings |
| Estimated take rate | ~30% | Derived from the two figures above |
Source: Marketplace Pulse third-party GMV estimate; Amazon.com, Inc. SEC filings.
Figure 2: Amazon’s estimated take rate on a third-party sale. Source: Amazon SEC filings; Marketplace Pulse GMV estimate, 2026.
How does third-party revenue compare with Amazon’s own retail sales?
Amazon’s first-party online stores revenue, money from products Amazon buys and resells itself, reached $269.3 billion in 2025. Third-party seller services revenue reached $172.2 billion the same year. Added together, that is $441.5 billion in combined retail-adjacent revenue, and third-party sellers supplied 39.0% of it, up slightly from 38.7% in 2024.
Figure 3: Amazon’s combined first-party and third-party retail revenue mix, 2025. Source: Amazon.com, Inc. SEC filings, as compiled by StockAnalysis.com.
The first-party business is still larger by dollar amount, but the marketplace side keeps closing the gap a little more each year. Every business that leans this heavily on a single sales channel, whether it is a first-party retailer or a marketplace seller, still needs terms that govern what happens outside that channel. A store selling through Amazon and its own site can generate a Terms and Conditions page for the parts of the business Amazon’s own agreement never touches.
How much of that revenue comes from FBA fees specifically?
Amazon does not publish an FBA-only revenue figure. The $172.2 billion third-party seller services line bundles referral commissions, FBA pick, pack, and storage fees, and other seller charges into one number, with no public split between them. That is a real transparency gap: analysts can estimate total marketplace GMV, and Amazon discloses total seller-services revenue, but no verified public source breaks out how much of that $172.2 billion specifically comes from fulfillment versus commissions.
Figure 4: How a marketplace sale becomes Amazon’s disclosed seller-services revenue line. Source: Amazon SEC filings; Amazon Seller Central fee schedule.
What is known is that FBA is the default for most sellers. Amazon’s own referral fee schedule sets commissions in the 8% to 15% range depending on category, and separate FBA fulfillment and storage charges apply on top for any seller who is enrolled. Until Amazon or a credible analyst publishes an FBA-only breakout, the honest answer is that a meaningful but unverified share of the $172.2 billion runs through fulfillment fees, not just commissions. Returns processing is another real cost layered on top of these fees; see our 2026 data on Amazon return rates and policies for how that piece of seller economics breaks down.
Is Amazon’s marketplace revenue growth slowing down?
Yes. Third-party seller services revenue grew 10.3% in 2025, the second straight year of deceleration after a 19.0% growth peak in 2023. The dollar total keeps setting new highs every year, but the growth rate itself has now cooled for two consecutive years.
Figure 5: Amazon’s third-party seller services revenue, year-over-year growth rate. Source: Amazon.com, Inc. SEC filings, as compiled by StockAnalysis.com.
Figure 6: Amazon’s four largest revenue lines positioned by 2025 dollar size and year-over-year growth rate. Source: Amazon.com, Inc. SEC filings, as compiled by StockAnalysis.com.
Third-party seller revenue sits in the “large and maturing” quadrant alongside Amazon’s own online stores business, while advertising and AWS, smaller in dollar terms, are growing several times faster in percentage terms. A slower growth rate on a $172.2 billion base still adds more new dollars in absolute terms than a faster growth rate on a much smaller one.
The Bottom Line
Amazon’s marketplace now generates $172.2 billion in disclosed revenue against an estimated $575 billion in third-party sales, a take rate near 30% once GMV estimates are weighed against Amazon’s own SEC filings. That revenue line has grown every year since at least 2021, even as its growth rate has cooled from a 19.0% peak in 2023 to 10.3% in 2025. What Amazon still does not disclose is how that $172.2 billion splits between referral commissions and FBA fulfillment fees specifically, which remains the biggest open question for anyone trying to model Amazon’s true marketplace economics from the outside. For sellers building a business that spans Amazon and other channels, the practical point is that Amazon’s own marketplace terms cover only the Amazon side of that revenue.
Frequently Asked Questions
What percentage of third-party sales does Amazon collect as revenue? An estimated 30%. Amazon’s disclosed third-party seller services revenue reached $172.2 billion in 2025 against roughly $575 billion in estimated third-party gross merchandise value, per Marketplace Pulse, a combined take rate near 30%.
How much revenue does Amazon’s marketplace generate? Amazon’s third-party seller services segment, covering referral commissions, fulfillment fees, and other seller charges, generated $172.2 billion in 2025, up 10.3% from $156.1 billion in 2024, according to Amazon’s own SEC filings.
How does third-party marketplace revenue compare to Amazon’s own retail sales? Combined, Amazon’s first-party online stores revenue ($269.3 billion) and third-party seller services revenue ($172.2 billion) reached $441.5 billion in 2025. Third-party sellers supplied 39.0% of that combined total, up from 38.7% in 2024.
How much of Amazon’s marketplace revenue comes from FBA fees specifically? Amazon does not disclose an FBA-only revenue figure. FBA fulfillment and storage charges are bundled inside the $172.2 billion third-party seller services line alongside referral commissions and other seller services, with no public breakout between them.
Sources and References
- StockAnalysis.com. “Amazon.com, Inc. (AMZN) Revenue by Segment.” Compiled from Amazon’s SEC filings, fiscal years 2024 and 2025.
- U.S. Securities and Exchange Commission. Amazon.com, Inc. Form 10-K annual report filings, EDGAR company filing index.
- Marketplace Pulse. (2026). “Amazon GMV Surpassed $800 Billion in 2025.” Analysis based on Amazon financial disclosures.
- Amazon. (2026). “How much does it cost to sell on Amazon: referral fee schedule.”
- Jungle Scout. (2024). “State of the Amazon Seller” survey data. Survey of nearly 2,000 sellers, conducted December 2023 to January 2024.
Note: All figures verified as of October 2026. Amazon’s segment revenue changes each quarter and GMV estimates are refreshed periodically by third-party analysts, so headline figures here are refreshed at least twice a year.