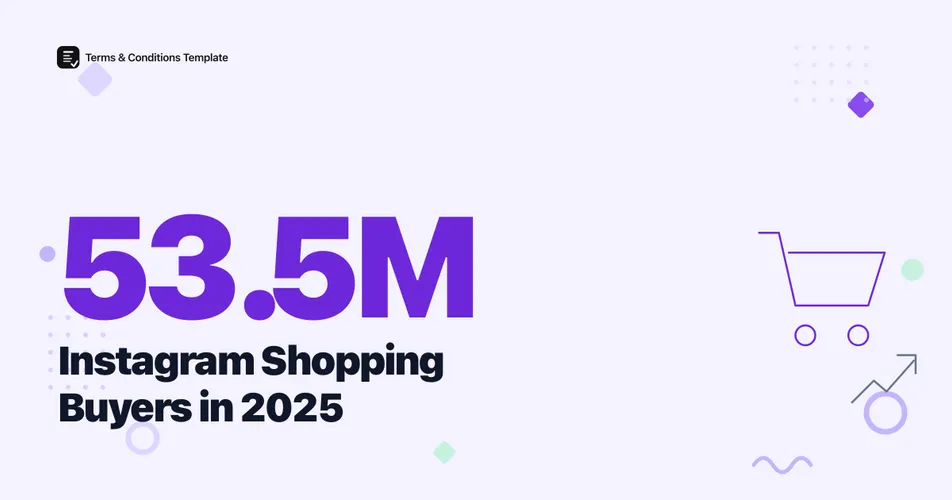
53.5 million Americans bought something through Instagram in 2025, up from 46.2 million in 2023, according to eMarketer data compiled by Capital One Shopping Research and last updated in March 2026. That growth, combined with an estimated $42.8 billion in US Instagram commerce sales the same year, has turned the app’s Shop tab and shoppable posts into a real checkout channel, not just a discovery feed. The numbers below, current as of early 2026, cover who is buying, how much they spend, and what a seller running an Instagram storefront still needs to cover on their own site.
How many Americans shop on Instagram?
53.5 million Americans made a purchase through Instagram in 2025, up from 46.2 million in 2023 and 46.8 million in 2024, according to eMarketer data compiled by Capital One Shopping Research. That works out to roughly 31% of all US Instagram users completing at least one transaction on the app that year, a share that has climbed steadily since Instagram Checkout and product tagging matured into everyday features rather than a novelty. A broader Capital One Shopping figure puts monthly Instagram shopping activity even higher: 21.9% of all US adults say they use the app at least once a month to browse or purchase products, a wider funnel than the 53.5 million who complete an actual transaction in a given year. Growth is not evenly spread across age groups either. Younger shoppers drive most of the increase, with 46.1% of Gen Z adults using Instagram monthly to browse or buy, compared with 37.7% of Millennials, 18.5% of Gen X, and just 2.1% of Baby Boomers, per Capital One Shopping’s compiled demographic breakdown. That skew matters for sellers deciding where to invest storefront setup time, since the audience most likely to buy is also the one least likely to have read a platform’s fine print before checking out.
Figure 1: US Instagram buyer growth by year. Source: eMarketer data compiled by Capital One Shopping Research, updated March 2026.
The pace of that growth outstrips overall Instagram user growth in the US, meaning the app is converting a larger slice of its existing audience into buyers each year rather than simply gaining new users who happen to shop. It also tracks the wider shift toward phones as the default shopping device; see our mobile commerce statistics for 2026 for how that plays out across online retail generally.
How much do people spend through Instagram shopping?
US Instagram social commerce sales reached an estimated $42.8 billion in 2025, according to Capital One Shopping Research’s compiled figures. Instagram shoppers also skew toward larger baskets than buyers on other platforms: eMarketer’s Social Media Forecast found that 8.7% of Instagram shoppers spent over $700 on the platform, a share at least 7.6 percentage points higher than any other social network measured.
| Metric | Figure | Source |
|---|---|---|
| US Instagram social commerce sales, 2025 | $42.8 billion | Capital One Shopping Research, compiled from eMarketer and Statista |
| US Instagram buyers, 2025 | 53.5 million | eMarketer, via Capital One Shopping Research |
| Instagram shoppers who spent $700+, 2025 | 8.7% | eMarketer Social Media Forecast |
| Instagram shoppers who spent $200+, 2025 | At least 7.6 pts higher than any other platform | eMarketer Social Media Forecast |
Higher average spend per buyer is a large part of why Instagram’s total sales figure sits well above what its buyer count alone would suggest, and it is a strong argument for treating an Instagram storefront as a real revenue channel rather than a marketing add-on.
Which platform do shoppers actually prefer for social commerce?
Instagram edges out TikTok Shop as the platform US adults say they would most likely use for social shopping. In eMarketer’s September 2025 survey of 1,483 US adults, 37.3% named Instagram as their preferred social shopping platform, ahead of TikTok Shop at 30.5% and Facebook behind both.
Figure 2: Share of US adults naming each platform as their preferred social shopping destination. Source: eMarketer survey, September 2025.
Preference is not the same as volume. Our TikTok Shop sales and sellers statistics for 2026 cover a platform whose US ecommerce sales are projected to hit $23.41 billion in 2026, growing faster off a smaller base than Instagram’s more mature commerce business. Instagram’s advantage also shows up in how often shoppers act on what they see: 62.8% of Instagram users say they actively follow or research brands and products on the app, according to DataReportal’s October 2025 data, well above general social media browsing rates.
Does a business selling through Instagram need its own Terms and Conditions?
Yes, and it is the gap most Instagram sellers overlook. Instagram’s Commerce Policies and seller agreements only govern what happens inside the app itself. The moment a seller also takes orders through their own website, replies to a purchase inquiry over direct message, or shares an off-platform checkout link, Instagram’s terms no longer apply to that transaction. That gap is not hypothetical: most small and mid-size Instagram sellers run a companion website or accept direct-message orders precisely because Instagram’s own checkout coverage remains partial and country-dependent.
Figure 3: The coverage test for an Instagram seller’s own Terms and Conditions. Source: synthesized from Meta’s published Commerce Policies structure.
With 53.5 million US buyers now transacting through the app and most independent sellers also running a website or accepting direct-message orders alongside their Instagram presence, that coverage gap touches a large share of the platform’s active sellers. A business can generate a Terms and Conditions page covering its own site, off-platform orders, refunds, and dispute terms in a few minutes, closing the gap that Instagram’s own policies leave open.
How much are brands spending on Instagram influencer marketing?
US brands spent an estimated $3.17 billion on Instagram influencer marketing in 2025, up 43.4% from $2.21 billion in 2024, according to Capital One Shopping Research’s compiled figures. That spending does not convert evenly across creator sizes. eMarketer’s engagement-by-tier data shows a steep drop as follower counts climb: nano-influencers, with 1,000 to 10,000 followers, post 6.23% engagement rates, while mega-influencers with over 1 million followers manage just 0.95%.
| Creator tier | Follower range | Engagement rate (eMarketer) |
|---|---|---|
| Nano | 1,000 to 10,000 | 6.23% |
| Micro | 10,000 to 50,000 | 2.73% |
| Mid-tier | 50,000 to 500,000 | 1.21% |
| Macro | 500,000 to 1,000,000 | 0.93% |
| Mega | 1,000,000+ | 0.95% |
Figure 4: Instagram engagement rate by creator follower tier. Source: eMarketer, 2025.
Brands spreading influencer budgets across nano and micro creators are chasing that engagement premium, even though it means managing far more individual partnerships and disclosure requirements than a single macro-influencer deal would involve. Every one of those partnerships still falls under standard advertising disclosure rules regardless of follower count, so a growing roster of small creators means a growing paper trail a brand has to keep organized.
How has Instagram’s shopping feature set evolved?
Instagram’s shopping tools have been built up gradually since 2018, when Meta first let brands tag products directly in feed posts. That original rollout came with a widely cited figure, 130 million accounts tapping a shopping post to reveal a product tag each month, a number Meta disclosed once in 2018 and has not refreshed publicly since. Treat it as a historical benchmark showing early demand, not a current usage figure; the 53.5 million verified buyers for 2025 above is the number to cite for today’s scale.
Figure 5: Key milestones in Instagram’s shopping feature rollout. Sources: Meta product announcements and 2025 eMarketer/Capital One Shopping Research data above.
Social commerce more broadly followed the same arc across platforms; see our social commerce statistics for 2026 for how Instagram’s growth compares to the wider $100 billion US social commerce market it sits inside.
The Bottom Line
53.5 million Americans now buy through Instagram, and the $42.8 billion in US sales that generates makes the platform’s Shop tab a real storefront, not a side experiment. That scale is exactly why the legal gap matters: Instagram’s Commerce Policies only cover what happens inside the app, so any seller also running a website, taking DM orders, or sharing off-platform checkout links is currently missing terms that apply to those sales. Closing that gap takes minutes, and it matters more each year as Instagram’s buyer base keeps growing faster than the app’s overall US user count.
Frequently Asked Questions
How many Americans shop on Instagram? 53.5 million Americans made a purchase through Instagram in 2025, up from 46.2 million in 2023, according to eMarketer data compiled by Capital One Shopping Research. That is roughly 31% of all US Instagram users.
How much do Instagram shoppers spend? US Instagram social commerce sales reached an estimated $42.8 billion in 2025. Instagram shoppers also skew toward bigger baskets: 8.7% spent over $700 on the platform, a larger share than any other social network, per eMarketer.
Is Instagram or TikTok Shop more popular for social shopping? Instagram edges out TikTok Shop for buyer preference. In eMarketer’s September 2025 survey of 1,483 US adults, 37.3% said Instagram is the platform they would most likely use for social shopping, ahead of TikTok Shop at 30.5%.
Does a business selling through Instagram need its own Terms and Conditions? Yes. Instagram’s Commerce Policies only govern activity that happens inside the app. Any seller who also takes orders through their own website, direct messages, or an off-platform link needs separate Terms and Conditions covering that activity.
Sources and References
- Capital One Shopping Research. (Updated March 2, 2026). “Instagram Shopping Statistics.” Compiled from eMarketer, Statista, and other named sources.
- SocialPilot. (2026). “Instagram Statistics.” Citing eMarketer’s September 2025 social shopping preference survey, n=1,483 US adults, and eMarketer engagement-by-tier data.
- Hootsuite. (2026). “Instagram Statistics.” Citing eMarketer’s 2026 US social buyer forecast data.
- Sprout Social. (2026). “Instagram Statistics.” Citing the 2025 Sprout Social Index and DataReportal’s October 2025 Instagram user data.
Note: All figures verified as of March 2026. Social commerce sales and buyer-count forecasts are revised as platforms report new data, so headline figures here are refreshed at least twice a year.