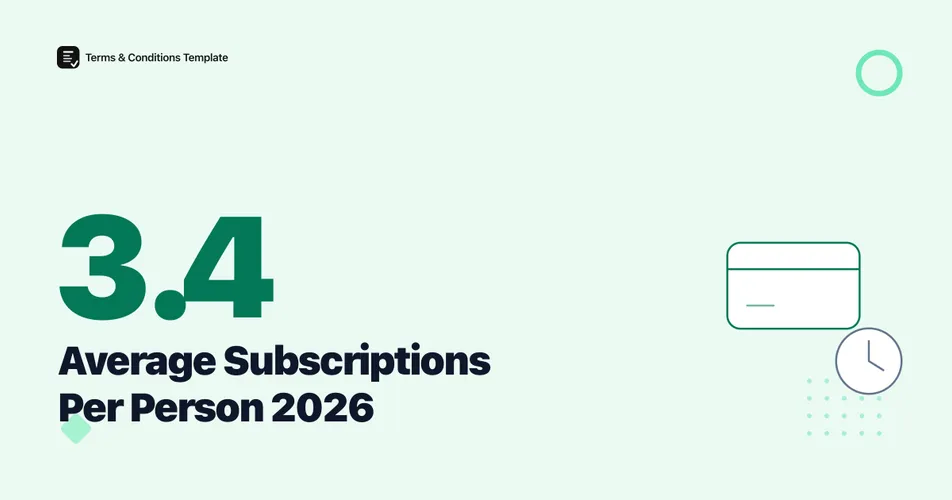
The average person carries 3.4 active paid subscriptions in 2026, down from 4.4 in 2023, according to Self Financial’s survey of 1,272 U.S. adults conducted in March 2026. That count only covers subscriptions people remember signing up for. Add the ones people forgot to cancel, and the picture changes: 59.9% of the same respondents admit at least one subscription is quietly running unused right now.
The number moves every year, and not in one direction. It fell sharply after 2023, then climbed again in 2026. What is more consistent is the gap between what people think they are paying for and what they are actually paying for, which is the real story behind every count below.
How many subscriptions does the average person have in 2026?
Self Financial’s 2026 “Cost of Unused Paid Subscriptions” survey asked 1,272 U.S. adults how many active paid subscriptions they hold in a typical month. The answer: 3.4 on average, up from 2.8 in 2025 but still well below the 4.4 recorded in 2023. Average monthly spend on those subscriptions has fallen alongside the count, from $52.97 in 2023 to $35.03 in 2026, suggesting people are actively trimming their subscription lists rather than just letting costs drift.
The direction of the trend matters more than any single year’s number. A count that swings from 4.4 to 2.8 to 3.4 in three years says more about how volatile subscription habits are than any one snapshot can.
Figure 1: Average active paid subscriptions per U.S. adult, 2023 to 2026. Source: Self Financial, survey of 1,272 U.S. adults, 2026 wave; earlier-year sample sizes are not disclosed in the current report.
How many subscriptions do people forget about each month?
The count of subscriptions people actively use is only part of the picture. 59.9% of people say a paid subscription is going unused in a typical month, and among that group the average is 2.6 unused subscriptions, according to Self Financial’s 2026 survey. That is a sharp jump from 2025, when 54.9% reported an unused subscription and the average was just 0.8. The monthly value of those unused subscriptions averages $26.79 in 2026.
Warning
The 3.4 figure above and the 2.6 unused figure here come from the same 2026 Self Financial survey but answer different questions, and the report does not state whether the unused subscriptions are counted inside or outside the 3.4 total. Treat them as two separate, real data points rather than assuming one is a simple subset of the other.
Forgetting to cancel is not a minor habit. 70% of people say they have stayed on a subscription specifically because they forgot to cancel it, at an average total cost of $34.31, per the same 2026 survey.
Figure 2: Average unused subscriptions per person, self-reported. Source: Self Financial, 2025 and 2026 survey waves.
The takeaway is direct: the subscription count on a bank statement and the subscription count someone would name from memory are two different numbers, and the gap between them is growing.
How many streaming subscriptions does the average household have?
Streaming is where subscription counting started, and it remains stubbornly high even as overall subscription counts fall. The average subscribing household keeps 4 streaming video services active, spending $69 a month on them, according to Deloitte’s 20th annual Digital Media Trends survey of 3,575 U.S. consumers age 14 and older, fielded in October and November 2025. 68% of subscribing households now pay for at least one ad-supported tier, trading a lower bill for ads rather than dropping a service outright.
That streaming-only average of 4 services sits above the 3.4 figure for all paid subscriptions combined, which points to a methodology difference rather than a contradiction: Deloitte’s figure counts only subscribing households and only streaming video, while Self Financial’s 3.4 covers every subscription category across all respondents. Reading either number as “the” subscription count without checking what it measures is how these figures get misquoted.
If you sell a subscription product yourself, this is also the category where cancellation friction gets the most public attention. A full breakdown of subscription market size, churn, and cancellation behavior covers what happens after someone decides a service is not worth keeping.
Why do people underestimate their subscription spending?
Consumers are not just forgetting individual subscriptions, they are undercounting the total. C+R Research’s 2022 survey of roughly 1,000 U.S. consumers found people guess they spend $86 a month on subscriptions, when the real total, calculated by asking about specific categories one at a time, averages $219 a month, a gap of $133. 42% of respondents admitted they had forgotten about a subscription they were still actively paying for.
Figure 3: The gap between guessed and actual monthly subscription spend. Source: C+R Research, survey of roughly 1,000 U.S. consumers, 2022.
This is an older survey relative to the others in this article, and C+R Research has not published a refreshed sample size or date since. The $133 gap is still widely cited because no newer study has replaced it with a directly comparable figure, so treat it as the best available benchmark rather than a current-year number.
Does subscription reliance vary by generation?
Age changes the picture substantially. 39% of millennials and 38% of “bridge millennials” (the cohort between millennials and Gen X) say they rely mainly on subscriptions for everyday shopping needs, compared with 31% of Gen Z, 24% of Gen X, and just 17% of baby boomers and seniors, according to PYMNTS and sticky.io’s “The Replenish Economy: A Household Supply Deep Dive” report, published in November 2023. PYMNTS does not disclose the sample size for this specific breakdown in the public report.
Figure 4: Reliance on subscriptions for everyday needs, by generation. Source: PYMNTS and sticky.io, “The Replenish Economy,” 2023.
Millennials and bridge millennials came of age alongside the subscription model itself, so it tracks that they lean on it hardest. Baby boomers, who spent most of their shopping lives without it, still use subscriptions the least even as adoption climbs across every generation.
Subscription counts and spending at a glance
| Year | Avg active subscriptions | Avg monthly spend | Avg unused subscriptions |
|---|---|---|---|
| 2023 | 4.4 | $52.97 | Not disclosed |
| 2025 | 2.8 | $37.00 | 0.8 |
| 2026 | 3.4 | $35.03 | 2.6 |
Source: Self Financial, “Cost of Unused Paid Subscriptions,” annual surveys of U.S. adults (n=1,272 for the 2026 wave).
| Metric | Figure | Source |
|---|---|---|
| Avg active subscriptions per person (2026) | 3.4 | Self Financial |
| Avg streaming services per subscribing household | 4 | Deloitte, 2025 |
| Guessed vs. actual monthly spend | $86 vs. $219 | C+R Research, 2022 |
| Millennials relying mainly on subscriptions | 39% | PYMNTS and sticky.io, 2023 |
How do you decide which subscriptions to keep or cancel?
The data above points to a simple test that cuts through most of the confusion: has the subscription actually been used in the last 30 days, and will it be needed again. Subscriptions that fail both questions are the ones quietly costing $26.79 a month on average without anyone noticing.
Figure 5: A simple test for deciding whether an active subscription is worth keeping.
Site owners running a subscription business sit on the other side of this same decision every day. A clear, easy-to-find refund and cancellation policy reduces exactly the kind of forgotten-signup frustration these numbers describe, and it is also what regulators and payment processors increasingly expect subscription merchants to publish. You can generate a refund policy that spells out how cancellations, prorations, and refund requests work before a customer ever has to ask.
Where does this subscription data come from?
The figures in this article come from four separate surveys, run by four different organizations, on different dates, with different sample sizes and different definitions of what counts as a subscription. That is normal for this topic and worth stating plainly rather than blending the numbers into one misleading average.
Figure 6: Publication timeline of the primary sources cited in this article.
The Bottom Line
There is no single correct answer to how many subscriptions the average person has. The most current, directly disclosed figure is 3.4 active paid subscriptions per U.S. adult in 2026, per Self Financial’s survey of 1,272 people, and it has swung from 4.4 to 2.8 to 3.4 in three years. Layer in the 2.6 unused subscriptions people separately report, the 4 streaming services the average subscribing household keeps, and the $133 a month people underestimate their own spending by, and the honest summary is that most people do not actually know their own subscription count without checking. If you run a subscription business, that confusion is exactly what a clear refund and cancellation policy exists to reduce.
Frequently Asked Questions
How many subscriptions does the average person have in 2026? The average U.S. adult has 3.4 active paid subscriptions in 2026, down from 4.4 in 2023 and up from 2.8 in 2025, according to Self Financial’s survey of 1,272 U.S. adults conducted in March 2026.
How many subscriptions go unused each month? 59.9% of people say they have at least one subscription going unused in a typical month, averaging 2.6 unused subscriptions, per Self Financial’s 2026 survey, up from 54.9% of people and an average of 0.8 unused subscriptions in 2025.
How many streaming subscriptions does the average household have? The average subscribing household keeps 4 streaming video services active, spending $69 a month on them, according to Deloitte’s 2025 Digital Media Trends survey of 3,575 U.S. consumers.
Why do people underestimate their subscription spending? Consumers guess they spend $86 a month on subscriptions when the real figure averages $219, a $133 gap, according to C+R Research’s 2022 survey of about 1,000 U.S. consumers. 42% admitted they had forgotten about a subscription they were still paying for.
Sources and References
- Self Financial. (2026). “Cost of Unused Paid Subscriptions.” Survey of 1,272 U.S. adults, conducted March 2026, with year-over-year data back to 2023.
- Deloitte. (2025). “Digital Media Trends,” 20th edition. Survey of 3,575 U.S. consumers age 14 and older, fielded October and November 2025.
- C+R Research. (2022). “Subscription Service Statistics and Costs.” Survey of approximately 1,000 U.S. consumers.
- PYMNTS and sticky.io. (2023). “The Replenish Economy: A Household Supply Deep Dive.” Sample size not disclosed in the public report.
Note: All figures verified as of August 2026. Subscription counts and spending shift with each new survey wave, so headline figures are refreshed at least twice a year. The C+R Research figures are the oldest in this article and should be replaced with a fresher study if one becomes available at the next refresh.