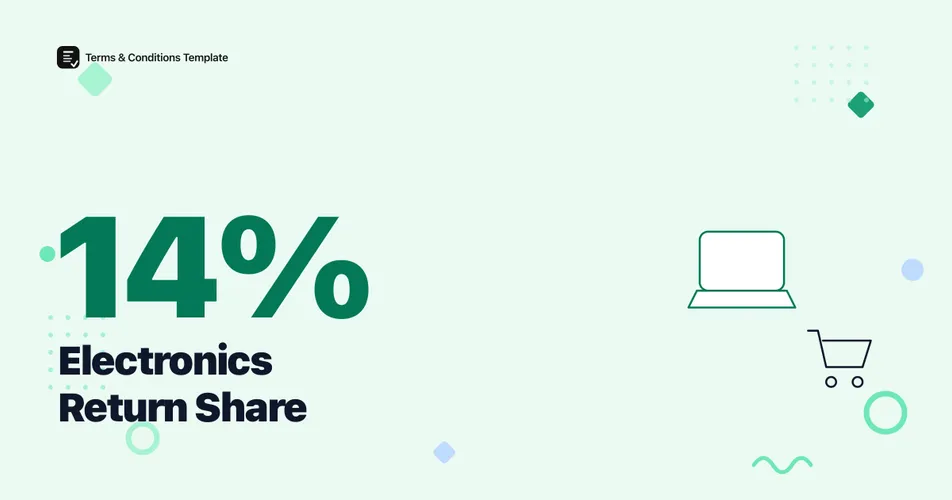
Electronics accounted for just 14% of all product returns in 2024, far below fashion’s 62% share of the same total, according to Loop Returns’ State of Returns report. That single number is also close to the most precise, recently dated figure available anywhere for electronics returns: no major 2025 study publishes a national electronics return rate as a share of orders the way it does for apparel. This post covers what is actually documented, and is explicit about what is not.
That gap matters for anyone selling electronics online. Return benchmarks shape restocking terms, warranty language, and how strict a refund policy needs to be, and electronics sellers have had far less published data to work from than clothing or footwear sellers.
What share of returns are electronics?
Electronics made up 14% of all product returns in Loop Returns’ State of Returns report, well behind fashion’s 62% share and slightly ahead of house-and-garden products at 9%. The remaining 15% spans every other category the report tracked. Loop’s report, published in August 2024, is a merchant-facing study distinct from the company’s separate Winter 2024 Benchmark Report; the sample size for the category breakdown was not disclosed in the trade press coverage this figure comes from, so treat the exact share as directional rather than a precise national count.
Figure 1: Category share of total product returns. Source: Loop Returns, “State of Returns” report (2024), as reported by Power Retail and RetailBiz, published August 2024.
Warning
The 14% and 62% figures above come from Loop Returns’ “State of Returns” report as covered by two Australian retail trade publications (Power Retail and RetailBiz); the primary report is distributed as a gated download and does not appear to be independently mirrored with its full methodology and sample size publicly disclosed. Treat this as a real, named, dated figure with a secondary citation trail, not a fully independently verified national statistic.
A 14% share of return volume is not the same measurement as a return rate against orders shipped, and no source in this post claims otherwise. It tells you how big a slice of a typical retailer’s returns desk electronics occupies, not what percentage of electronics orders come back.
Why doesn’t anyone publish an exact electronics return rate?
Because the industry’s own most-cited recent consumer survey declines to give one. Statista Consumer Insights’ US survey, published April 2025, found clothing was the category consumers most often said they had returned in the past 12 months, at 25% of respondents, followed by shoes at 17% and accessories at 12%. The same release states that furniture, books, and consumer electronics see lower return rates than those three categories, without publishing an exact percentage for any of them.
Figure 2: Only three categories carry a disclosed percentage in this survey. Electronics, furniture, and books are named as lower-return categories but withheld from the published figures. Source: Statista Consumer Insights, US survey, published April 2025.
That is a genuine data gap, not an oversight on this site’s part. Multiple ecommerce benchmarking blogs cite an informal range of roughly 8% to 15% for electronics return rates, but none of the ones checked for this post discloses a named primary dataset, survey instrument, or sample size behind that range, so it is repeated here only as a directional rule of thumb, not a sourced statistic. Readers who need a defensible number for their own reporting should use the 14% return-share figure above, cited to its named source, rather than the untraceable range.
Is electronics a high-fraud return category?
Relatively, yes, even without a precise headline percentage. Radial and Two Boxes’ July 2025 survey of 200 US retailers covered six industries, including consumer electronics alongside apparel and footwear, home improvement and garden, sports and fitness, home furnishings, and health and beauty. The report states directly that apparel and footwear brands “deal with policy abuse more than any other surveyed industry outside of consumer electronics,” placing electronics as the second-highest category for that specific fraud type among the six surveyed.
Policy abuse, a customer returning an item outside the stated window or terms, was also the fraud type apparel and footwear brands named most often (65% of them), which puts electronics in a notable position: high-ticket items with return terms that fraud actors specifically target for policy loopholes. The same report found 44% of all surveyed brands, across every category, call managing returns fraud and abuse their biggest current pain point.
For an electronics seller, that ranking is a practical argument for a return policy that states a specific condition-on-return standard, since higher-value items create more incentive for policy abuse than the low-value goods common in less fraud-affected categories.
How does electronics compare to other return categories?
The clearest way to place electronics is against the categories that do have published national figures.
| Metric | Value | Source | Year |
|---|---|---|---|
| Electronics’ share of all product returns | 14% | Loop Returns | 2024 |
| Fashion’s share of all product returns | 62% | Loop Returns | 2024 |
| Blended online return rate, all categories | 19.3% | NRF / Happy Returns | 2025 |
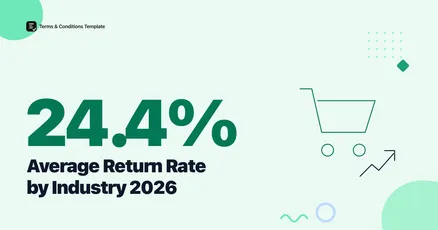
| Apparel and footwear average online return rate | 24.4% | Coresight Research | 2023 |
| Shoppers who returned clothing in the past 12 months | 25% | Statista Consumer Insights | 2025 |
Every disclosed figure in this table places electronics below the general apparel and clothing benchmarks. Our clothing return rate data and ecommerce return rate data cover those higher-return categories in more depth; there is not yet a published furniture-specific return rate benchmark on this site, so treat any furniture comparison as directional only until that data is available.
What should an electronics return policy account for?
Because no national return-rate benchmark exists for electronics, the safest starting point is the general online blended rate, 19.3% in 2025, as an upper-bound reference rather than a category-specific target. Electronics returns skew toward defect, DOA (dead-on-arrival), and compatibility issues more than the fit and sizing problems that drive apparel returns, which argues for a policy structured around inspection and warranty terms rather than a generic remorse window copied from a clothing store.
Figure 3: A policy-setting path for electronics sellers working without a category-specific benchmark. Source: synthesized from the findings above.
Figure 4: Timeline of the returns research that touches electronics, 2023 to 2025. Sources: Coresight Research, Loop Returns, Radial and Two Boxes, Statista Consumer Insights.
An electronics seller documenting condition at intake, requiring original packaging for a full refund, and stating a defect-versus-remorse distinction addresses both the fraud exposure Radial and Two Boxes flagged and the reality that this category simply has less published benchmark data to lean on than apparel does. Our Refund Policy Generator builds those terms, defect window, restocking condition, and refund method, from your actual product mix rather than a generic clause built for a different category.
The Bottom Line
Electronics is a genuinely under-benchmarked return category. The one dated, named figure available, a 14% share of total return volume against fashion’s 62% (Loop Returns, 2024), is real but should not be mistaken for a return-rate percentage, and no 2025 or 2026 survey checked for this post publishes one. What is documented is directional and consistent: electronics sits below the 19.3% blended online return rate, well below apparel’s 24.4% average, and ranks second only to apparel and footwear for return policy-abuse fraud among the six categories Radial and Two Boxes surveyed in 2025. A return policy for electronics should be built around that fraud exposure and a defect-versus-remorse distinction, not a category benchmark that does not yet exist in published form.
Frequently Asked Questions
What percentage of returns are electronics? Electronics account for 14% of all product returns, well behind fashion’s 62% share, according to Loop Returns’ 2024 State of Returns report. No major 2025 survey publishes a single national electronics return rate as a share of orders.
Why doesn’t anyone publish an exact electronics return rate? Statista Consumer Insights’ April 2025 survey states that furniture, books, and consumer electronics return at lower rates than clothing (25%), shoes (17%), and accessories (12%), but the underlying release does not disclose exact percentages for those lower-return categories.
Is electronics a high-fraud return category? Relatively, yes. Consumer electronics ranked as the second-highest of six retail categories for return policy abuse, behind only apparel and footwear, according to Radial and Two Boxes’ July 2025 survey of 200 US retailers.
What return rate does electronics sit below? The blended online return rate across all retail categories was 19.3% in 2025, according to the National Retail Federation and Happy Returns. Every source that discusses electronics places the category below that blended figure.
Sources and References
- Loop Returns. (2024). “State of Returns: The Road to Retention and Reconversion.” Cited via RetailBiz and Power Retail trade coverage, published August 2024; primary report distributed as a gated download.
- Statista Consumer Insights. (2025). “Clothing and Shoes Are the Most Returned Online Purchases.” US consumer survey, published April 2025.
- Radial and Two Boxes. (2025). “The State of Retail Returns in 2025.” Survey of 200 retailers across apparel/footwear/accessories, home improvement and garden, sports and fitness, home furnishings, health and beauty, and consumer electronics, conducted July 2025.
- National Retail Federation and Happy Returns. (2025). “2025 Retail Returns Landscape.” Survey of 2,006 consumers and 358 ecommerce professionals at US retailers with over $500 million in revenue, conducted summer 2025.
- Coresight Research. (2023). “The True Cost of Apparel Returns.” Survey of 100 US apparel and footwear brand and retailer decision-makers, conducted March 2023.
Note: All figures verified as of September 2026. No category-specific electronics return-rate percentage has been published by a named primary source as of this writing; this post will be updated if one is published.