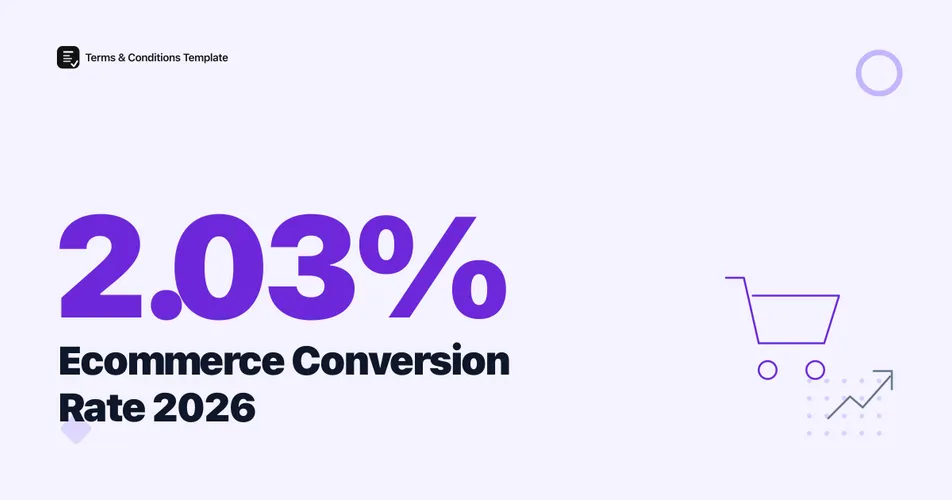
The UK ecommerce conversion rate reached 2.03% in June 2026, up 9.7% year over year from 1.85% in June 2025, according to IRP Commerce’s live panel of SME and mid-market online stores. That single number is a useful pulse check, but conversion rate varies sharply by device, industry, and how a shopper arrived at the site, so a blended average hides most of what actually explains a store’s performance.
If you run a checkout, the numbers below matter for one practical reason: conversion rate is one of the few metrics you can move without spending more on traffic. Clear terms, a fast checkout, and a policy shoppers can find before they abandon their cart all show up directly in the rate.
What is the average ecommerce conversion rate in 2026?
The average ecommerce conversion rate sits somewhere between 1.4% and 2.9% depending on the source and the population measured. IRP Commerce’s live UK and Ireland merchant panel put the figure at 2.03% for June 2026. Littledata’s benchmark of 2,800 Shopify sites puts the average lower, at 1.4%, while Shopify’s own blog cites Statista’s global figure of 1.6% of visits converting into a purchase in the third quarter of 2025. None of these numbers are wrong; they measure different populations with different methodologies, which is exactly why treating one blended average as a universal target is a mistake.
Warning
IRP Commerce’s 2.03% figure comes from a continuously updated dashboard, not a fixed annual report, so treat it as a snapshot as of June 2026 rather than a settled yearly number. The rate moves with seasonality: IRP itself reported conversion closer to 1.56% to 1.59% earlier in the first quarter of 2026, before the mid-year figure climbed. Any live-dashboard figure cited in this article should be read the same way, current as of its reporting month rather than a fixed constant.
Figure 1: UK ecommerce conversion rate, June 2026. Source: IRP Commerce live merchant panel.
The table below lines up the three most-cited 2026 baselines side by side. Each is correct for the population it measures, which is why comparing your own store’s rate against the source whose sample looks most like your business matters more than chasing a single global average.
| Source | Population measured | Conversion rate |
|---|---|---|
| IRP Commerce | UK/Ireland SME and mid-market merchants, June 2026 | 2.03% |
| Littledata | 2,800 Shopify stores, 2023 benchmark | 1.4% |
| Statista (via Shopify) | Global online retail visits, Q3 2025 | 1.6% |
Source: IRP Commerce; Littledata; Statista data cited by Shopify.
Whichever baseline you use, the direction across sources agrees: conversion rate improved modestly into mid-2026 after a period of decline. More importantly, the gap between the best and worst performing segments below, by device, industry, and traffic source, is far larger than the gap between any two of these overall averages, which is the real reason a single number is not a useful target on its own.
Figure 2: Year-over-year change in the IRP Commerce UK conversion rate benchmark. Source: IRP Commerce, June 2026 report.
Does conversion rate differ by device?
Yes, and the gap is large and consistent across sources. Littledata’s Shopify benchmark shows desktop converting at 1.9% against 1.2% for mobile, even though smartphones account for roughly 78% of retail site visits worldwide, per Statista’s Q3 2025 data cited by Shopify. Mobile brings the traffic; desktop closes more of it. Part of the gap is behavioral rather than technical: desktop sessions tend to happen at points when a shopper has already decided to buy and is finishing the purchase on a larger screen with saved payment details, while a large share of mobile sessions are early-stage browsing, comparison shopping, or window shopping during a spare few minutes rather than a checkout session in progress.
Figure 3: Device share of retail site visits. Source: Statista, Q3 2025 data, cited by Shopify.
The mismatch shows up again in order share. Smartphones generate only about 70% of online orders despite that 78% visit share, a small but persistent conversion gap that has held for several years running. IRP Commerce’s UK panel reports a similar order-share split for June 2026: mobile devices accounted for 63.5% of sales, desktop 35%, and tablet the remaining 1.4%. A store’s traffic mix and its order mix by device are rarely identical, and the difference between the two is a rough proxy for how much conversion friction still lives specifically in the mobile checkout. Slow-loading mobile pages, cramped form fields, and a payment step that was designed for a mouse and keyboard rather than a thumb all compound to widen this gap further than the raw traffic numbers alone would suggest.
Figure 4: Conversion rate by device. Source: Littledata, 2,800 Shopify sites benchmarked.
A store optimized only for desktop is optimizing for the smaller and shrinking share of its own traffic. Closing even part of the mobile-desktop gap is usually worth more than chasing a marginal lift in overall traffic.
Which ecommerce industries have the highest conversion rates?
Conversion rate varies more by industry than by almost any other factor in this article. Food and beverage stores convert at 6.22% on a trailing 12-month basis, more than six times the rate for luxury and jewelry at 0.94%, according to industry-level data Shopify’s own blog cites. Beauty and personal care follows at 4.94%, and multi-brand retail at 3.93%.
| Industry vertical | Conversion rate |
|---|---|
| Food and beverage | 6.22% |
| Beauty and personal care | 4.94% |
| Multi-brand retail | 3.93% |
| Pet care and veterinary | 3.28% |
| Fashion, accessories, apparel | 3.06% |
| Consumer goods | 2.85% |
| Luxury and jewelry | 0.94% |
Source: trailing 12-month industry benchmarks cited by Shopify.
The pattern tracks purchase frequency and price point more than anything else. Food, beverage, and beauty are repeat, low-consideration purchases; luxury and jewelry are high-consideration, infrequent ones, so a low conversion rate there is not automatically a sign of a broken checkout.
Figure 5: Conversion rate by industry vertical. Source: trailing 12-month benchmarks cited by Shopify’s blog.
Compare your rate against your own category, not the blended 2% to 3% average that circulates across the wider industry. A 2% rate is disappointing for a food and beverage store and strong for a jewelry retailer.
How much does traffic source affect conversion rate?
Owned channels convert far higher than paid discovery channels, though exact percentages vary enough across sources that the safest read is directional rather than exact. Omnisend’s 2025 analysis of more than 20 billion campaign emails and 470 million automated sends across 27,000-plus ecommerce brands found automated emails, meaning abandoned cart, back-in-stock, and welcome series messages, converting at 1.49%, against just 0.08% for one-off campaign sends, with back-in-stock automations alone converting at 6.46%.
Warning
Several 2025 and 2026 benchmark roundups cite more specific channel percentages, such as email converting around 4% and paid social under 1.5%, but most trace back to compiled aggregator data rather than a single named, disclosed-methodology ecommerce study. Ruler Analytics’ 2026 report, based on 5 million-plus tracked conversions across 13 industries, found a similar ranking, with organic search and email around 4.9% and paid and organic social closer to 2.1% to 2.2%, but that data spans lead-generation industries alongside ecommerce, so treat the exact figures as directional, not ecommerce-specific.
The consistent finding across every source, regardless of exact percentage, is that a shopper who already knows your brand converts several times more often than one arriving cold from a paid or social placement. That is the channel to protect first when a marketing budget gets cut, and it is also the channel where clear, easy-to-find policies do the most work, since a returning customer is more likely to check your terms before repurchasing than a first-time visitor is.
Where do shoppers actually drop off in the funnel?
Most of the conversion loss happens after a shopper has already shown intent, not at the initial landing page. Littledata’s Shopify data shows an average add-to-cart rate of 4.6%, meaning roughly 1 in 22 visitors adds an item, but checkout completion sits at only 45% once a cart is started. That two-step drop, from browse to cart to completed order, is where a clear returns policy and transparent terms tend to matter most, and checkout-usability researchers such as Baymard Institute have long flagged unclear policies and hidden costs as recurring reasons shoppers abandon a cart at exactly this stage.
Figure 6: The Shopify conversion funnel from visit to order. Source: Littledata, 2,800 Shopify sites benchmarked.
Publishing clear terms and conditions before checkout, rather than burying them in a footer link, is a low-cost way to close part of that gap. You can generate a terms and conditions policy that states your return window, payment terms, and liability limits in plain language, matched to the funnel stage where shoppers are already deciding whether to trust your store enough to finish paying.
For a deeper look at where and why shoppers give up before paying, see our breakdown of cart abandonment rates by industry and how unexpected shipping costs specifically drive abandonment at the final step. Both funnel stages sit downstream of the same add-to-cart and checkout numbers cited above, so fixing the terms and cost transparency at that point tends to move more than one metric at once.
Figure 7: Key device-share and conversion rate milestones. Sources: Adobe Digital Economy Index; IRP Commerce.
The Bottom Line
There is no single correct ecommerce conversion rate to benchmark against. The UK-wide average sits around 2%, Shopify’s own merchant base averages closer to 1.4%, and the true range across industries runs from under 1% for luxury goods to over 6% for food and beverage. The more useful exercise is comparing your rate against your own vertical and device mix, then closing the specific gaps that show up, whether that is a slow mobile checkout, a missing returns policy, or a traffic mix too dependent on cold paid social. Fix the funnel stage where shoppers are actually dropping off, and the blended average takes care of itself.
Frequently Asked Questions
What is a good ecommerce conversion rate in 2026? Most benchmarks put the average between 1.4% and 2.9%, so a rate above 3% is generally considered strong. Littledata’s analysis of 2,800 Shopify stores puts the top 20% above 3.2% and the top 10% above 4.7%.
Do mobile visitors convert at a lower rate than desktop? Yes. Littledata’s Shopify benchmark shows mobile converting at 1.2% versus 1.9% on desktop, even though smartphones drive around 78% of retail site visits, according to Statista’s Q3 2025 data cited by Shopify.
Which ecommerce industries have the highest conversion rates? Food and beverage leads at 6.22%, followed by beauty and personal care at 4.94%, based on trailing 12-month industry data Shopify cites. Luxury and jewelry sits lowest at 0.94%, a gap of roughly 6.6 times.
Which traffic source converts best for ecommerce stores? Email and other owned channels consistently convert several times higher than paid social. Omnisend’s 2025 analysis of over 20 billion campaign emails and 470 million automated sends found automated emails converting at 1.49% versus 0.08% for one-off campaign sends.
Sources and References
- IRP Commerce. (2026). “Ecommerce Market Data and Ecommerce Benchmarks.” Live UK and Ireland SME/mid-market merchant panel, June 2026 report.
- Littledata. “Average Ecommerce Conversion Rate.” Benchmark of 2,800 Shopify sites, 2023 data.
- Shopify. “How to Improve Ecommerce Conversion Rates.” Cites Statista global and device data (Q3 2025) and trailing 12-month industry benchmarks.
- Omnisend. (2025). “2025 Ecommerce Marketing Report.” Analysis of 20 billion-plus campaign emails and 470 million automated sends across 27,000-plus brands.
- Ruler Analytics. (2026). “Conversion Rate Benchmarks.” 5 million-plus tracked conversions across 13 industries, multi-touch attribution.
- Adobe Digital Economy Index. (2025-2026). UK and US online holiday spending reports, mobile revenue share data.
- Baymard Institute. Checkout Usability Research. Ongoing benchmark study of checkout abandonment causes.
Note: All figures verified as of October 2026. IRP Commerce’s live panel figure updates monthly and will drift from the June 2026 snapshot cited here; headline figures in this post are refreshed at least twice a year.