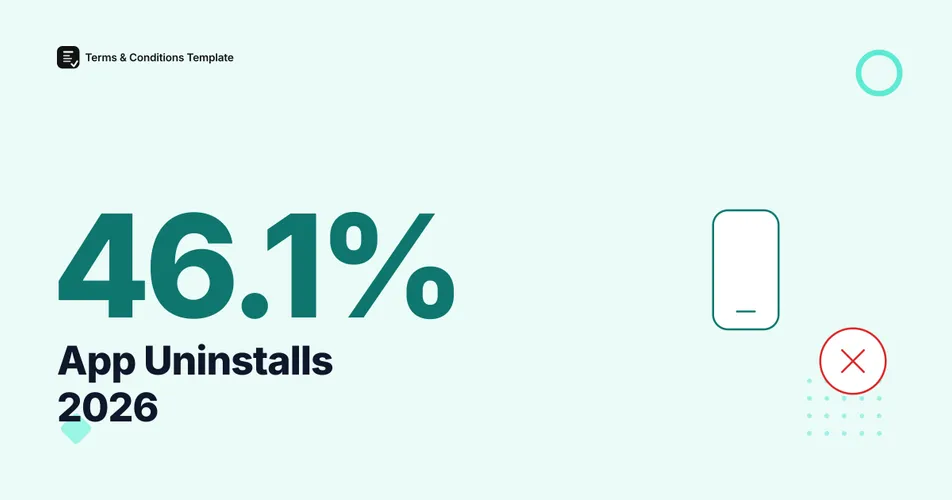
46.1% of Android app installs were uninstalled within 30 days in 2024, according to AppsFlyer’s App Uninstall Report, 2025 Edition, which tracked 402 million uninstalls across 1.3 billion installs and 2,200 apps. That means close to half of every install a developer wins is gone within a month, and the reasons users cite, permissions, notifications, and unclear data practices, sit squarely in territory that a clear app EULA and privacy notice can address.
What percentage of apps are uninstalled within 30 days?
Figure 1: Share of Android app installs uninstalled within 30 days, 2024. Source: AppsFlyer, App Uninstall Report, 2025 Edition.
AppsFlyer’s figure, drawn from anonymized, aggregated data spanning January 2023 to November 2024, actually represents a small year-over-year improvement: the 30-day uninstall rate eased from 46.9% in 2023 to 46.1% in 2024. That is still, in the report’s own framing, “more than 1 in every 2 apps installed” effectively gone within a month once installs and reinstalls are weighed together, since the rate crosses 50% for several major categories individually.
Figure 2: What happens to an app install by day 30. Source: AppsFlyer, App Uninstall Report, 2025 Edition.
Which app categories have the highest uninstall rates?
Dating apps lose the most installs of any major category tracked: 57.8% of organically-acquired dating app users uninstall within 30 days, rising to 62.4% for users who arrived through paid ad campaigns. Gaming follows close behind at roughly 51%. At the other end, Travel apps hold on to more users, at a 29.2% uninstall rate, and News & Magazines apps have the lowest rate in the report at 27.3%.
Figure 3: 30-day uninstall rate by app category, 2024. Source: AppsFlyer, App Uninstall Report, 2025 Edition.
| Category | 30-day uninstall rate | Notes |
|---|---|---|
| Dating | 57.8% (organic) / 62.4% (paid) | Highest of any major category |
| Gaming | ~51% | Second highest |
| All categories (average) | 46.1% | 2024 global Android average |
| Travel | 29.2% | Lowest among major categories |
| News & Magazines | 27.3% | Lowest overall |
Finance apps do not top the uninstall-rate ranking, but AppsFlyer flags a distinct pattern there: a pronounced Day 1-to-Day 2 drop-off, and the highest monetary cost of any category, averaging an estimated $100,000 in lost value per month from uninstalls. Shopping and lifestyle apps with strong brand recognition tend to hold onto users better than more transactional or novelty categories, though the report does not publish an exact Shopping-category rate.
Does uninstall behavior vary by country?
Yes, by a wide margin. South Asian markets post the highest 30-day uninstall rates in AppsFlyer’s dataset: Bangladesh at 65.56%, Nepal at 65.27%, and Pakistan at 64.58%. The United States and United Kingdom sit near the bottom of the range, at 48.02% and 47.90%.
Figure 4: 30-day uninstall rate by country, 2024. Source: AppsFlyer, App Uninstall Report, 2025 Edition.
Warning
AppsFlyer’s dataset is Android-only; iOS uninstall tracking has been limited since Apple’s App Tracking Transparency changes shipped in iOS 15, so comparable cross-platform uninstall figures are not available from this report. Treat every rate above as an Android-specific number, not a total-market figure.
The gap likely reflects a mix of factors AppsFlyer does not fully separate in this report: device storage constraints on lower-cost Android hardware common in South Asian markets, data cost sensitivity, and differences in how aggressively local app markets promote installs through paid campaigns that attract lower-intent users. Whatever the cause, a business shipping the same app worldwide should expect very different retention curves by region, which matters directly for how app store statistics on downloads translate into actual active users.
Why do users actually delete an app?
Push notifications are one of the clearest, most measurable triggers. Airship’s push notification benchmark data finds that a single week of 2 to 5 messages is enough to make 46% of recipients opt out of notifications, rising to 32% opting out even at a lower 6-to-10-message pace, since fatigue compounds rather than resets. Business of Apps’ 2026 push notification benchmarks put a harder number on the worst outcome: roughly 6% of recipients uninstall the app outright after a single heavy notification week, not just mute it.
Figure 5: How permission and notification transparency affects uninstall risk. Source: synthesized from GoodFirms 2025 survey findings and Airship/Business of Apps notification benchmark data above.
Permissions carry similar weight. A GoodFirms survey conducted in October 2025 found 86% of respondents said they would uninstall an app over poor performance or excessive permission requests, and 43% specifically pointed to requests for personal data access they did not consider necessary; GoodFirms did not publish the underlying sample size for that survey, so treat the exact percentages as directional rather than precise. The pattern lines up with the AppsFlyer country and category data above: users delete fastest when an app’s behavior, what it asks for, how often it interrupts, does not match what they expected when they installed it.
A EULA that plainly states what permissions an app uses and why, rather than a generic template copied from another product, is one of the few uninstall triggers a developer can address directly. You can generate a EULA that matches your app’s actual permission and notification behavior rather than a boilerplate list that invites the exact distrust these surveys describe.
The Bottom Line
Just under half of all Android app installs disappear within 30 days, and the categories and countries with the worst rates share a common thread: a mismatch between what the app asked for, whether that is a permission, a notification, or attention, and what the user expected going in. Dating and gaming apps lose the most installs; Travel and News apps lose the fewest. Push notification fatigue and permission distrust are the two most measurable, addressable causes in the data, and both are directly shaped by how clearly an app’s EULA and privacy notice explain what the app actually does with a user’s device and data.
Frequently Asked Questions
What percentage of apps are uninstalled within 30 days? 46.1% of Android app installs were uninstalled within 30 days in 2024, according to AppsFlyer’s App Uninstall Report, 2025 Edition, based on 402 million tracked uninstalls across 1.3 billion installs and 2,200 apps.
Which app category has the highest uninstall rate? Dating apps have the highest 30-day uninstall rate of any major category, at 57.8% for organically acquired users and 62.4% for users acquired through paid campaigns, per AppsFlyer’s 2024 data.
Do push notifications cause uninstalls? Yes. Airship’s push notification benchmark data finds 46% of recipients opt out of notifications after receiving 2 to 5 messages in a single week, and Business of Apps’ 2026 push notification benchmarks estimate about 6% uninstall the app outright after a heavy notification week.
Do privacy and permissions concerns drive uninstalls? Yes. A GoodFirms survey conducted in October 2025 found 86% of respondents said they would uninstall an app over poor performance or excessive permission requests, and 43% specifically cited requests for unnecessary personal data access; GoodFirms did not publish the underlying sample size for that survey.
Sources and References
- AppsFlyer. “App Uninstall Report, 2025 Edition.” 402 million uninstalls, 1.3 billion installs, 2,200 apps analyzed, Android, January 2023 to November 2024.
- Airship. (2026). “Mobile App Push Notification Benchmarks.” Opt-in and opt-out rates across 15+ industries.
- Business of Apps. (2026). “Push Notifications Statistics.”
- GoodFirms. (2025). Survey on app permissions and uninstall behavior, conducted October 2025.
Note: All figures verified as of August 2026. AppsFlyer’s uninstall benchmarks are published annually and are refreshed here at least twice a year alongside newer editions.