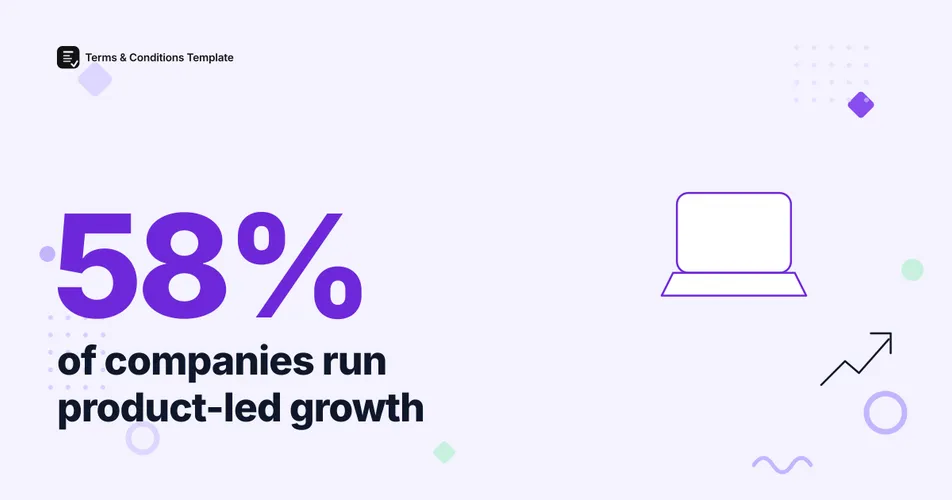
Product-led growth has stopped being a strategy some SaaS companies try and become the default most of them run. Mixpanel’s 2026 State of Digital Analytics report, drawn from behavioral data across more than 12,000 companies and 3.7 trillion tracked events, found that 58% of companies now operate a product-led growth model, letting the product itself, not a sales team, drive the first steps of the customer relationship.
How many companies actually run product-led growth?
58% of the companies in Mixpanel’s 2026 dataset run some form of product-led growth, meaning users can experience meaningful value in the product before a salesperson ever gets involved. Mixpanel’s report is built on 3.7 trillion behavioral events across 22 billion devices, giving it a scale most self-reported PLG surveys cannot match.
Figure 1: Share of companies running a product-led growth model. Source: Mixpanel, 2026 State of Digital Analytics report, 12,000+ companies.
The trend has been building for years. OpenView Partners’ earlier Product Benchmarks research tracked PLG adoption climbing from 45% to 55% among the software companies it surveyed, and Mixpanel’s 58% figure for 2026 confirms that growth has continued rather than plateaued. Mixpanel measures this from actual product usage data rather than a self-reported survey question, which is a meaningfully different method from most of the earlier PLG adoption figures that circulated in the industry, and it is part of why the 58% number carries more weight than a simple poll result would.
Which free-trial model actually converts better?
The gap between trial models is large and consistent. ChartMogul’s SaaS Conversion Report, a January 2026 study of 200 B2B software products, found opt-in trials, the kind that let a user start without entering a credit card, convert at roughly 6% or less on average, while trials that require a credit card upfront convert at 30%, more than five times higher. Freemium products, where a user can stay on a free tier indefinitely rather than hitting a trial deadline, typically convert in the 3% to 5% range.
Figure 2: Free-to-paid conversion rate by signup model. Source: ChartMogul SaaS Conversion Report, January 2026, 200 B2B software products.
The credit-card-required model converts more than five times as well as the opt-in model, but only 20% of free-trial products in ChartMogul’s sample actually require a credit card upfront; the other 80% choose the lower-converting, higher-volume opt-in path. The two numbers are not measuring the same funnel stage: a company choosing between them is really choosing between a smaller, more qualified trial pool and a larger, less committed one. The median conversion rate across all 200 products, trial and freemium combined, was 8%, which is the number worth quoting when a single benchmark is needed rather than either extreme.
Does product-led growth actually drive faster revenue growth?
Yes, by a meaningful margin. OpenView Partners’ Product Benchmarks research, based on a survey of more than 450 software companies, found that product-led and freemium companies are twice as likely to grow revenue 100% or more year over year compared to companies relying on a traditional sales-led motion. Our SaaS market data puts that growth advantage in the context of the broader $315.68 billion SaaS market these companies are competing in. The growth advantage compounds over time rather than showing up as a one-off spike, since a product-led funnel keeps adding new trial and freemium signups on top of whatever a sales team closes separately.
Figure 3: The typical product-led growth funnel from signup to paid conversion. Source: synthesized from ChartMogul and OpenView data above.
Every one of those signups, whether it converts or not, agrees to a set of terms the moment they create an account, which makes a current terms and conditions agreement one of the few pieces of legal infrastructure that touches literally every user a PLG funnel brings in, not just the ones who eventually pay. Our free trial conversion data breaks down how that funnel performs across different SaaS categories and price points.
The volume math matters here: a company converting even 6% of a much larger opt-in trial pool can end up with more paying customers in absolute terms than a company converting 30% of a smaller credit-card-gated pool, depending entirely on how many people actually sign up for each version of the funnel. That is one more reason terms and conditions coverage cannot be an afterthought reserved for paying customers only, since the free side of the funnel is often the larger population by a wide margin. A dispute, a data request, or a support escalation is just as likely to come from a free user as a paying one, and the terms agreed to at signup are what govern that interaction either way.
How much does product quality actually affect retention?
Figure 4: Share of companies running a product-led growth model. Source: Mixpanel, 2026 State of Digital Analytics report.
Retention is where product-led companies separate from each other most sharply. Mixpanel’s 2026 data found weekly B2B product retention ranging from 44.6% among bottom-quartile products to 77.9% among top-quartile products, a 33-point gap the report attributes largely to differences in activation quality between top and bottom performers. A separate benchmark, High Alpha’s 2025 SaaS Benchmarks report of over 800 companies, found that retaining 9 out of 10 customers is the norm across all ARR bands at the account level, which is a different and generally higher figure than Mixpanel’s product-usage retention number, since account-level retention counts a customer as retained even if their day-to-day product usage has quietly declined. Reading the two figures together gives a fuller picture than either alone: a company can hold onto 9 of 10 accounts on paper while still sitting in the bottom quartile on the usage signal that predicts whether those accounts renew next year. That gap between logo retention and usage-based retention is exactly where a renewal conversation tends to go badly if nobody has been watching the underlying product engagement in the months leading up to it. Tracking both numbers side by side, rather than reporting only the friendlier one, is what separates the top quartile from the bottom in Mixpanel’s data.
Figure 5: Weekly B2B product retention, bottom versus top quartile. Source: Mixpanel, 2026 State of Digital Analytics report.
The size of that quartile gap is the real argument for treating activation as a first-class metric rather than an afterthought, since the companies at the top of it are not just retaining slightly better, they are retaining at nearly double the rate of the companies at the bottom. Our SaaS retention benchmarks go deeper into how net revenue retention specifically splits between high- and low-performing SaaS companies.
Product-led growth metrics compared
| Metric | Figure | Source |
|---|---|---|
| Companies running PLG | 58% | Mixpanel, 2026 |
| Opt-in trial conversion | ~6% or less | ChartMogul, January 2026 |
| Credit-card-required trial conversion | 30% | ChartMogul, January 2026 |
| Freemium conversion | 3-5% | ChartMogul, January 2026 |
Source: Mixpanel State of Digital Analytics 2026; ChartMogul SaaS Conversion Report, January 2026.
The Bottom Line
Product-led growth is no longer a differentiator, it is the operating model for 58% of companies as of 2026, and the companies still relying purely on a sales-led motion are increasingly the exception rather than the norm. The bigger competitive gap now sits inside PLG itself: a 33-point retention spread between top- and bottom-quartile products, and a conversion rate that varies more than threefold depending on whether a trial requires a credit card. Every signup in that funnel, converting or not, is also a legal relationship that starts the moment they accept a site’s terms, which makes the terms and conditions document one of the few pieces of infrastructure that scales cleanly with PLG’s whole-funnel growth.
Frequently Asked Questions
What percentage of companies use product-led growth? 58% of companies now run a product-led growth model, according to Mixpanel’s 2026 State of Digital Analytics report, which analyzed behavior across more than 12,000 companies and 3.7 trillion events.
What is a good free trial conversion rate? Opt-in trials that do not require a credit card convert at roughly 6% or less on average, while trials requiring a credit card upfront convert at 30% on average, more than five times higher, according to ChartMogul’s SaaS Conversion Report, a January 2026 study of 200 B2B software products. Freemium signups, where a user can stay on a free tier indefinitely, typically convert in the 3% to 5% range.
Do PLG companies grow faster than sales-led companies? Product-led and freemium companies are twice as likely to grow revenue 100% or more year over year compared to sales-led companies, according to OpenView Partners’ Product Benchmarks report, based on a survey of over 450 software companies.
What is a good retention rate for a PLG company? Retaining 9 out of 10 customers is the norm across all ARR bands, according to High Alpha’s 2025 SaaS Benchmarks report of 800+ companies. At the product-usage level, Mixpanel’s 2026 data shows weekly B2B retention ranging from 44.6% for bottom-quartile products to 77.9% for top-quartile products.
Sources and References
- Mixpanel. (2026). “2026 State of Digital Analytics: Benchmarks, Analysis, and Recommendations.” Behavioral data across 12,000+ companies, 3.7 trillion events, 22 billion devices.
- OpenView Partners. “Product Benchmarks Report.” Survey of 450+ software companies; PLG companies twice as likely to grow revenue 100%+ year over year.
- High Alpha. (2025). “SaaS Benchmarks Report.” Survey of 800+ companies, 69% US-based, 17% European.
- ChartMogul. (2026). “The SaaS Conversion Report.” Analysis of 200 B2B software products, data collected January 2026.
Note: All figures verified as of August 2026. Product-led growth benchmarks shift as new annual reports publish, so headline figures are refreshed at least twice a year.