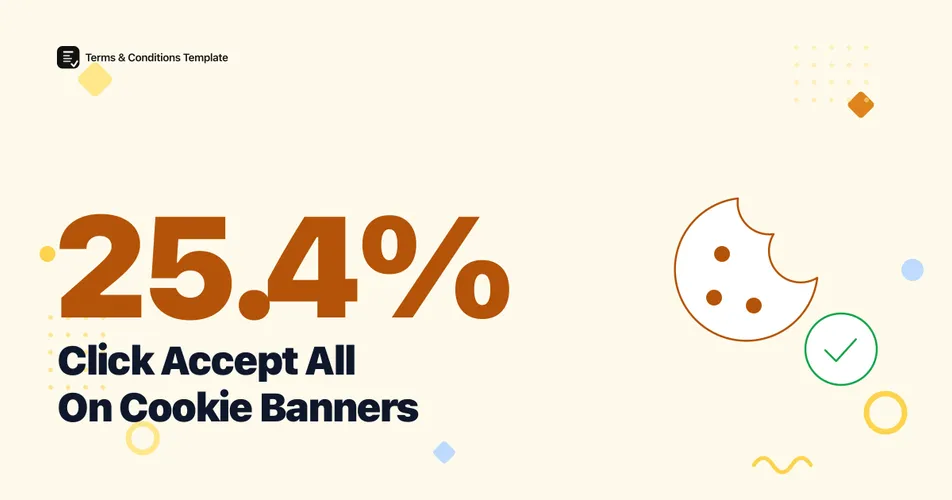
Only 25.4% of website visitors click “Accept all” the moment a cookie banner appears, according to Advance Metrics’ 2023 analysis of more than 1.2 million visitor interactions on international B2B sites. Another 33.6% ignore the banner completely, and the rest reject it or take some other action. The number gets repeated constantly in 2026, roughly a quarter of visitors, and it is also the number most often stripped of the context that explains it.
That context matters because a separate, self-reported survey lands close to the same figure, which is unusual for cookie research, where click data and stated preferences often pull apart. What moves the accept-all rate far more than anything a visitor believes about privacy is the banner design in front of them, and how few visitors ever look past the first screen.
What percentage of users accept all cookies?
About 25.4% of visitors click “Accept all” on their first interaction with a cookie banner, according to Advance Metrics’ study of over 1.2 million business-audience visitors, with data collected across January to June 2023. Another 33.6% ignore the banner outright, and the remaining 41% reject it or take some other action, such as closing the tab or scrolling past without clicking anything the tool records. These are observed first-click numbers pulled from real sessions, not survey self-reports, which is why researchers treat them as a stronger baseline than the “average accept rate” figures that circulate on vendor blogs without a disclosed method.
Figure 1: What happens on a visitor’s first interaction with a cookie banner. Source: Advance Metrics, 1.2M+ visitors, 2023 data.
A quarter accepting everything is not a majority position. It means three out of four visitors either ignore the prompt, reject it, or do something else entirely, which is worth remembering the next time a headline claims “most users accept all cookies.”
Has the accept-all rate changed over time?
The clearest trend is not in the accept-all number itself but in how many visitors engage with a banner at all. Advance Metrics compared its 2023 dataset against a 2018 baseline from the same B2B site pool and found that the share of visitors who ignore a banner completely fell from 76% in 2018 to 33.6% in 2023, a drop of 42.4 percentage points over five years. Banners got harder to ignore as regulators pushed sites toward more visible, more interruptive consent interfaces.
Figure 2: Banner engagement over five years. Source: Advance Metrics, 2018 baseline compared with 2023 data (1.2M+ visitors).
The 2018 dataset did not break out an accept-all figure on its own, so a direct five-year comparison of the accept-all rate is not possible from this source. What the trend does show is that a rising share of the “other 74.6%” is now an active decision rather than a shrug, which raises the stakes of banner design covered further down.
Do people say they accept all cookies as often as they click it?
Close to it, which is worth flagging because self-reported privacy behavior usually diverges from what click data shows. In an August 2025 survey of 1,000 U.S. adults conducted for All About Cookies via Pollfish, 24% said they blindly accept all cookies when prompted, a quarter reported rejecting optional cookies by default, and 27% said they manually select which cookies to allow. That 24% self-reported figure sits within a point of the 25.4% observed click rate from Advance Metrics’ much larger dataset.
Warning
These two figures are not measuring the same population under the same conditions. Advance Metrics tracked B2B site visitors globally in 2023; All About Cookies surveyed U.S. consumers about their general habits in 2025. The agreement between 24% and 25.4% is a useful directional signal, not proof that self-report and click behavior always match this closely.
Figure 3: Self-reported cookie behavior among U.S. adults. Source: All About Cookies survey, n=1,000, August 2025.
The same survey found only 11% of respondents could correctly identify all the ways cookies are actually used, which helps explain why a self-reported “blind accept” answer and an observed first-click accept rate can end up so close: neither group is making a fully informed choice.
Does banner design change the accept-all rate?
Substantially, and the effect is documented in more than one controlled study. Nouwens et al.’s CHI 2020 field experiment tested 8 common banner designs on 40 participants and found that removing the reject option from the first screen raised the accept rate from 55% to 77%, a jump of 22 percentage points from that single design change. Separately, etracker’s 2025 benchmark of German websites found sites with a legally compliant, equally visible reject button average a 40% consent rate, against 54% for sites using a nudging design that visually favors the accept button. The two studies use different definitions (accept-all versus overall consent) and different site pools, but both land on the same conclusion: the button layout decides more of the outcome than visitor intent does.
Figure 4: How banner design changes the accept-all or consent rate across two independent studies. Sources: Nouwens et al., CHI 2020 (n=40); etracker 2025 benchmark (German sites, sample size not disclosed).
If your banner is quietly built to maximize accept-all clicks, you are inflating a number that will not survive a regulator’s audit. Pairing an honest banner with a current, ready-made cookie policy is the more durable way to handle the gap between what a banner extracts and what the law actually requires.
How many visitors customize their cookie settings instead of accepting all?
Very few. Advance Metrics’ 2023 data shows that only 0.4% of visitors ever open granular cookie settings, meaning nearly everyone’s decision happens at the first-level accept, reject, or ignore stage covered above. Among that small 0.4% who do dig into settings, 65.5% go on to save individual, customized selections, 17.5% close the settings panel via the X icon without saving anything, and 17% click accept all a second time at the second level.
Figure 5: What happens after a visitor opens cookie settings instead of deciding at first click. Source: Advance Metrics, 2023 data.
This is the part of the accept-all number that rarely makes it into a headline. The 25.4% figure is not visitors weighing granular options and choosing “all of them.” It is almost entirely a first-screen decision, made by people who never see a settings panel at all.
Is “accept all” consent legally reliable?
Often not. A CHI 2025 study by Nouwens, Kristensen, et al. analyzed 254,148 websites across 31 EU and ePrivacy countries and found that only 15% of the top 10,000 sites run a minimally GDPR-compliant banner, one that shows Accept and Reject with equal prominence. Fifty-six percent of non-compliant banners skip a reject option entirely, which means a share of the “accept-all” clicks measured across the industry come from banners that never gave visitors a real alternative. Enforcement has caught up with the gap: France’s CNIL fined Google 325 million euros and Shein 150 million euros in 2025, both decisions tied to cookies set without valid consent.
Figure 6: How accept-all behavior, design research, and enforcement have moved together. Sources: Advance Metrics (2018, 2023 data), Nouwens et al. CHI 2020, All About Cookies 2025 survey, CNIL 2025 decisions.
For an interlinked look at overall consent rates and GDPR compliance trends, see Cookie Consent Statistics 2026. For the deeper data on how specific button choices move accept and reject clicks, see Cookie Banner Statistics 2026.
Accept-all behavior at a glance
| Measure | Value | Source | Year |
|---|---|---|---|
| Observed: accept all on first click | 25.4% | Advance Metrics (1.2M+ visitors) | 2023 |
| Self-reported: blindly accept all cookies | 24% | All About Cookies (n=1,000, US) | 2025 |
| Self-reported: reject optional cookies by default | 25% | All About Cookies (n=1,000, US) | 2025 |
| Self-reported: manually customize selections | 27% | All About Cookies (n=1,000, US) | 2025 |
| Banner design | Accept-all / consent rate | Study |
|---|---|---|
| Reject button hidden on first screen | 77% | CHI 2020 field experiment (n=40) |
| Reject button shown on first screen | 55% | CHI 2020 field experiment (n=40) |
| Nudging design (visually favors accept) | 54% | etracker 2025 benchmark (German sites) |
| Compliant, equally visible reject | 40% | etracker 2025 benchmark (German sites) |
The Bottom Line
The 25.4% accept-all figure is real, sourced, and worth citing, but it is also a design outcome more than a preference. Nearly three in four visitors do not accept everything, most decisions happen in the first two seconds on a banner that almost nobody digs into further, and the single biggest lever on the number is whether the reject button is visible at all. A site that wants an accurate, defensible accept rate needs a banner that shows both options equally, and a cookie policy that matches what the banner actually does. Treat 25.4% as a floor to compare your own numbers against, not a target to engineer toward.
Frequently Asked Questions
What percentage of users accept all cookies? About 25.4% of visitors click Accept all on their first interaction with a cookie banner, based on Advance Metrics’ 2023 study of more than 1.2 million visitors to international B2B sites. Another 33.6% ignore the banner completely.
Do people say they accept all cookies as often as they actually click it? Close to it. In an August 2025 survey of 1,000 U.S. adults by All About Cookies, 24% said they blindly accept all cookies when prompted, within a point of the 25.4% observed click rate from a separate, larger dataset.
Does the design of a cookie banner change the accept-all rate? Yes, by more than 20 percentage points in controlled testing. Hiding the reject button on the first screen raised the accept rate from 55% to 77% in a CHI 2020 field experiment with 40 participants across 8 banner designs.
How many visitors customize their cookie settings instead of accepting all? Very few. Only 0.4% of visitors ever open granular cookie settings at all, according to Advance Metrics’ 2023 data. Among that small group, 65.5% go on to save individual selections rather than clicking accept all a second time.
Sources and References
- Advance Metrics. (2024). “Cookie Behaviour Study, 5 Years After GDPR.” Observed first-click and second-level behavior of 1.2M+ visitors, data period January to June 2023, compared against a 2018 baseline.
- All About Cookies. (2025). “Cookies Study: 1 in 4 Americans Blindly Accept Internet Cookies.” Survey of 1,000 U.S. adults via Pollfish, August 2025 wave.
- Nouwens, Liccardi, Veale, Karger, Kagal. (2020). “Dark Patterns after the GDPR: Scraping Consent Pop-ups and Demonstrating their Influence.” CHI 2020, ACM. Field experiment with 40 participants across 8 banner designs.
- Nouwens, Kristensen, et al.. (2025). “A Cross-Country Analysis of GDPR Cookie Banners and Flexible Methods for Scraping Them.” CHI 2025, ACM. Analysis of 254,148 websites across 31 countries.
- etracker. (2025). “Cookie Consent Benchmark Study.” German website sample; overall sample size not publicly disclosed.
- CNIL. (2025). Google cookie consent decision, 325 million euro fine. Official regulator decision.
- CNIL. (2025). “Cookies Placed Without Consent: Shein Fined 150 Million Euros.” Official regulator decision.
Note: All figures verified as of August 2026. Cookie consent behavior and enforcement change quickly, so headline figures here are refreshed at least twice a year.