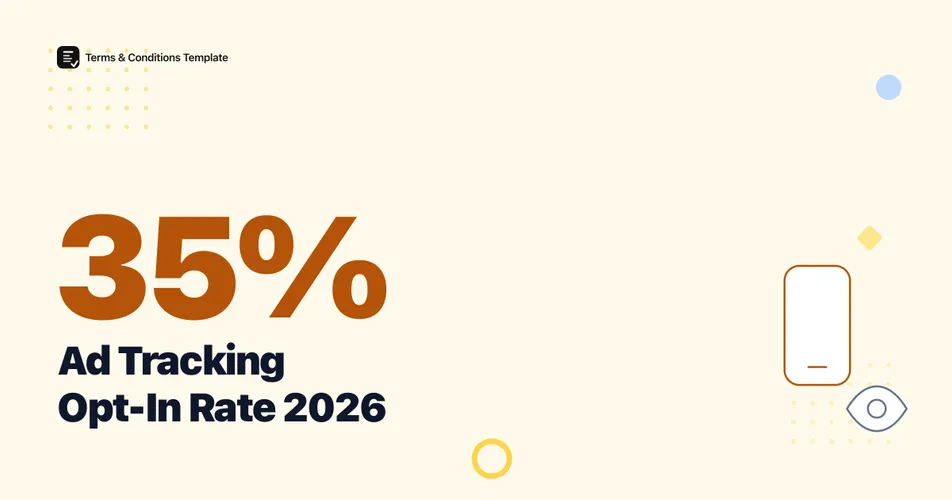
Only 35% of iOS users opted in to app tracking in 2025, according to mobile measurement company Adjust’s App Tracking Transparency (ATT) benchmark data, up from just 16% when Apple’s ATT prompt first launched in May 2021. Ad tracking has not disappeared. It has moved past what a single browser popup or app prompt can stop.
The average website still loads trackers from five separate companies and fires eight tracking requests every time a page loads, per Ghostery’s WhoTracks.me analysis of the top 10,000 sites worldwide. What has changed since 2021 is which methods do the tracking, and how many users actively refuse it once they are actually asked.
How many ad trackers does the average website carry?
The average website loads trackers from 5 separate companies and fires 8 tracking requests per page load, according to Ghostery’s WhoTracks.me, which continuously monitors data collectors on the top 10,000 most visited websites worldwide. About 1,060 of those 10,000 sites, or roughly 1 in 10, carry more than 10 trackers on a single page, and trackers pull an average of 14MB of data per page load.
Google’s own tools dominate that footprint. Google Tag Manager appears on 37.7% of monitored sites and Google Static on 36.41%, while a Meta tracking pixel shows up on 41.1% of websites, often without a visible disclosure in the site’s cookie banner.
Figure 1: Prevalence of the most common ad trackers across the top 10,000 websites. Meta and Google figures mix page-presence and traffic-share measures per WhoTracks.me’s own reporting. Source: Ghostery WhoTracks.me, ongoing monitoring, data as of 2026.
If your site runs any of these tools, each one belongs in your cookie policy’s disclosure list, not just your analytics dashboard.
What tracking methods do advertisers use besides cookies?
Cookies are no longer the majority method. Only 34.0% of trackers on the top 10,000 websites still rely on cookies, per WhoTracks.me, which means the remaining 66% run on pixels, device fingerprinting, or server-side data collection that never touches a browser cookie jar at all.
That shift matters for compliance. A cookie banner that only manages cookie consent leaves two-thirds of a site’s actual tracking activity undisclosed and unmanaged.
Figure 2: Share of trackers on the top 10,000 websites that still depend on cookies versus other methods. Source: Ghostery WhoTracks.me, ongoing monitoring.
Is browser fingerprinting replacing cookies as an ad tracking method?
Partially. Device fingerprinting, which identifies a visitor from device and browser signals instead of a stored cookie, was found on more than 25% of the top 10,000 websites and over 10% of the top 100,000 websites, according to Iqbal, Englehardt, and Shafiq’s FP-Inspector study, published at IEEE Symposium on Security and Privacy 2021 and based on a crawl of 100,000 sites.
Warning
This remains the largest academic measurement of fingerprinting prevalence with a disclosed methodology and sample size, but the underlying crawl data is now several years old. No fresher large-scale academic figure with comparable disclosure was found during this article’s research, so treat 25% as a floor rather than a current reading, given how much ad-tech tooling has shifted toward non-cookie methods since 2021.
Fingerprinting survives where cookie blocking does not, because it reads signals a browser exposes by default rather than storing anything a user can delete.
Figure 3: Which ad tracking methods survive default browser privacy settings. Source: Safari, Firefox, and Brave privacy documentation; Iqbal, Englehardt, Shafiq, IEEE S&P 2021.
How many iPhone users actually allow ad tracking?
Most do not. 35% of iOS users opted in to app tracking in 2025, per Adjust’s ATT benchmark data, meaning the remaining 65% either actively deny the prompt or fall into a restricted-tracking state where the choice is made for them at the device level. That 35% figure is an industry-wide average across app categories; Adjust does not disclose the underlying device or install sample size for this aggregate number.
Gaming apps have historically shown higher opt-in than the industry average, while categories seen as more sensitive, such as finance and health apps, tend to run below it. The practical effect for advertisers is the same either way: roughly two out of three iOS users are now invisible to cross-app tracking by default.
Has the ATT opt-in rate changed since Apple introduced it?
Yes, it has climbed steadily but remains a minority behavior. The opt-in rate moved from 16% in May 2021, when Apple’s ATT prompt first launched with iOS 14.5, to 25% by Q1 2022, 29% by Q1 2023, 34.5% by Q2 2024, and 35% by 2025, according to Adjust’s ATT benchmark reporting.
Figure 4: iOS App Tracking Transparency opt-in rate over time. Source: Adjust ATT benchmark reports, as reported via MediaPost (2023 recap) and Adjust’s 2025 ATT benchmark update.
The climb looks like recovery for advertisers, but it plateaued well under half. Even at its 2025 level, ATT opt-in still leaves roughly two-thirds of iOS users outside cross-app ad tracking, a decline that mobile ad measurement has had to build around rather than reverse.
Are third-party cookies actually going away in 2026?
Not on the timeline the industry expected. Google confirmed in April 2025 that it will not deprecate third-party cookies in Chrome, keeping them on by default with a user-level opt-out instead of removing them. Chrome and Edge together still carry the largest share of global browser traffic, so third-party cookies remain functional for most of the web even as Safari, Firefox, and Brave continue blocking them by default. For the current browser-by-browser breakdown, see Browser Market Share 2026: Who Blocks Cookies?.
The reversal caught much of the industry off guard. An IAB survey of more than 500 agency, brand, publisher, and ad-tech professionals, conducted in July 2024 around Google’s initial delay announcement, found nearly two-thirds were surprised by the shift away from full deprecation.
Figure 5: Key ad tracking milestones, 2018 to 2025. Sources: GDPR (2018), Apple ATT launch data, Google Privacy Sandbox, IAB.
For a closer look at where third-party cookies still function and where they are blocked, see Third-Party Cookie Statistics 2026: Phase-Out Numbers. Whichever methods your site relies on, the fastest way to stay compliant is to generate a compliant cookie policy that names every tracker your pages actually load, not just the ones a banner plugin detects automatically.
ATT opt-in rate by year
| Year | ATT opt-in rate | Source |
|---|---|---|
| May 2021 | 16% | Adjust |
| Q1 2022 | 25% | Adjust |
| Q1 2023 | 29% | Adjust |
| Q2 2024 | 34.5% | Adjust |
| 2025 | 35% | Adjust |
Which tracking methods survive privacy-focused browsers?
| Tracking method | Requires a cookie | Blocked by default (Safari, Firefox, Brave) | Blocked by default (Chrome, Edge) |
|---|---|---|---|
| Third-party cookies | Yes | Yes | No, opt-out only |
| Device fingerprinting | No | Partially | No |
| Mobile ad ID (IDFA, GAID) | No | Requires ATT prompt (app-level) | Requires ATT prompt (app-level) |
| Server-side or first-party pixel | No | No | No |
The Bottom Line
The single most useful number in this data is not a reach figure, it is the 35% opt-in rate. Ad tracking did not shrink because regulators or browsers switched it off. It shrank because, given a real choice, roughly two-thirds of users decline it, and the industry responded by building tracking methods that need less of a user’s cooperation to keep working. Cookies now account for barely a third of trackers on the average major website, and the rest run through pixels, fingerprinting, and server-side signals that a cookie banner alone was never built to disclose. Publishing an accurate, current cookie and tracking policy is the one control a site owner still has over that gap.
Frequently Asked Questions
What percentage of iPhone users allow ad tracking? 35% of iOS users opted in to app tracking in 2025, up from 16% when Apple’s App Tracking Transparency prompt launched in May 2021, per Adjust’s ATT benchmark data. The rest deny the prompt or never see it because tracking is restricted at the device level.
How many ad trackers does the average website run? The average website loads trackers from 5 separate companies and fires 8 tracking requests per page load, per Ghostery’s WhoTracks.me analysis of the top 10,000 websites worldwide. About 1 in 10 of those sites carries more than 10 trackers per page.
Do advertisers still rely mainly on cookies to track users? No. Only 34.0% of trackers on the top 10,000 websites still rely on cookies, per WhoTracks.me, with the remaining 66% using pixels, device fingerprinting, or server-side methods that a cookie banner alone cannot stop.
Is browser fingerprinting a bigger privacy risk than cookies? It is harder to block. Fingerprinting scripts were found on more than 25% of the top 10,000 websites and over 10% of the top 100,000, per Iqbal, Englehardt, and Shafiq’s FP-Inspector study (IEEE S&P 2021), the largest academic measurement of fingerprinting prevalence published to date.
Sources and References
- Adjust. (2025). “App Tracking Transparency Opt-In Rates 2025.” Industry-wide ATT benchmark data; sample size not publicly disclosed for the aggregate figure.
- MediaPost. (2023). “Privacy Update: ATT Opt-In Rate Now Up To 29%.” Citing Adjust’s 2023 Mobile Apps Trend report.
- Ghostery WhoTracks.Me. Ongoing analysis of data collectors on the top 10,000 most visited websites worldwide.
- Iqbal, Englehardt, Shafiq. (2021). “FP-Inspector: Automated Detection of Browser Fingerprinting.” IEEE Symposium on Security and Privacy 2021. Crawl of 100,000 websites.
- IAB. (2024). “Google’s Shift on Third-Party Cookies: Industry Reactions, Business Impact, and What Comes Next.” Survey of over 500 industry professionals, July 2024.
- Google Privacy Sandbox. (2025). Update on the plan for third-party cookies in Chrome.
Note: All figures verified as of September 2026. ATT opt-in rates and tracker prevalence change frequently, so headline figures here are refreshed at least twice a year. Rolling and live-monitored figures (WhoTracks.me) are flagged in-text as ongoing measurements rather than fixed historical facts.