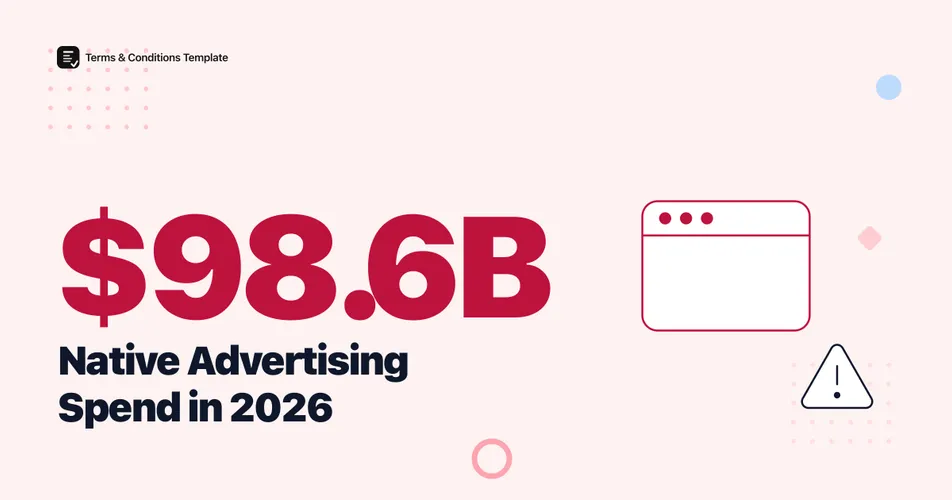
US native advertising spending reached $98.6 billion in 2023, according to eMarketer, more than 59% of all US digital display ad spend and up 37% from 2021. Sponsored articles, promoted listings, and in-feed placements now sit inside almost every major publisher’s layout, and disclosure rules decide which of them are legal.
Brands favor the format because it blends into a feed instead of interrupting it, but that same blending is what draws regulator scrutiny. The numbers below cover how much native advertising costs, how it performs against plain display ads, and what happened the last time a major retailer skipped the disclosure fine print.
How much do brands spend on native advertising?
US native ad spend hit $98.6 billion in 2023, per eMarketer’s US native advertising forecast, after jumping 37% in a single year between 2021 and the 2023 mark. That growth outpaced the broader digital display market, so native’s share of total display spend kept climbing alongside the dollar figure itself.
By 2023, native formats accounted for more than 59% of every dollar spent on US digital display advertising, leaving standard banner and rich-media placements with a shrinking minority of the budget.
Figure 1: Native advertising’s share of total US digital display spend. Source: eMarketer, US Native Advertising Forecast, 2023 data.
Native is no longer a side experiment next to a publisher’s banner inventory. It is now the majority format inside digital display, which is exactly why disclosure has become a compliance issue rather than a style preference.
How much of that spend flows to video?
Video is where native growth concentrated. In 2022, native video ads made up 84.1% of all US video ad spend, up nearly two percentage points from 2021, according to eMarketer’s figures as compiled by Outbrain. That share includes in-feed autoplay clips, promoted video recommendations, and branded video units styled to match a platform’s native player.
Figure 2: Native format’s share of total video ad spend, year over year. Source: eMarketer, via Outbrain’s 2022 native advertising compilation.
Social advertising moved in the opposite direction over the same stretch, per the same compilation, which is part of why publishers kept investing in native video inventory instead of standard pre-roll.
Do native ads actually earn more attention than display ads?
Yes, by a wide margin on the metrics vendors publish. Consumers look at native ads 53% more than they look at standard display ads, and native placements generate an 18% increase in purchase intent, according to Outbrain’s own campaign data. A separate Outbrain-commissioned Savanta survey found native advertising rated as the least intrusive ad format among the options tested, with social media advertising rated the most intrusive.
These are vendor-reported numbers from a company that sells native ad placements, so they should be read as directional rather than independently audited. The same caution applies broadly to trust research around any content readers cannot immediately tell is paid, the same blind spot behind our online review trust data, where readers also struggle to separate genuine signals from promoted ones.
Attention and intent lift explain why brands keep buying native inventory. They do not explain whether readers know what they are looking at, which is a separate question the sections below take on directly.
Does campaign length change what native ads cost?
It does, and the direction favors patience. Native campaigns that run longer than six months carry a 36.4% lower average cost-per-click than campaigns running six months or less, per Outbrain’s campaign benchmark data. Advertisers who add lookalike audience targeting to a native affiliate campaign see roughly 3x the conversions and at least a 35% drop in cost-per-acquisition compared to campaigns without it.
Figure 3: Relative cost-per-click by native campaign duration. Source: Outbrain campaign benchmark data.
A native campaign built and abandoned in a single quarter is the most expensive way to run the format. The cost curve rewards advertisers who treat native placements as an ongoing channel rather than a one-off push.
Which drives more native ad clicks, mobile or desktop?
Mobile does, disproportionately. Among affiliate advertisers, mobile-specific spend makes up about half of total affiliate native budget, yet it drives 65% of all clicks at a 48% lower cost-per-click than desktop, according to Outbrain’s affiliate marketing data. The same imbalance shows up across the broader affiliate marketing spend data, where mobile-first buying behavior keeps pulling budget away from desktop-first placements.
Figure 4: Share of affiliate native ad clicks by device. Source: Outbrain affiliate marketing guide.
If a native campaign is not built mobile-first, it is leaving both cheaper clicks and a majority of total click volume on the table.
What happens when native ads and sponsored content aren’t disclosed?
The FTC requires that native advertising be clearly and conspicuously labeled, in a format and position a reader will actually notice, so paid content is never mistaken for a publisher’s own independent editorial. The standard applies whether the placement is a sponsored article, a promoted listing, or a paid social post from an influencer.
The clearest example of what happens when a brand skips that step is the FTC’s 2016 case against Lord & Taylor. The retailer paid 50 fashion influencers between $1,000 and $4,000 each to post themselves wearing the same dress, and separately paid for an article in Nylon magazine, without disclosing either arrangement. The Instagram campaign alone reached 11.4 million users and generated 328,000 engagements with the brand’s account before the dress sold out. The FTC’s resulting settlement bars Lord & Taylor from misrepresenting paid content as independent editorial and requires clear disclosure of any compensation behind an endorsement.
Figure 5: The FTC’s basic disclosure test for native and sponsored content. Source: FTC native advertising guidance, applied to the 2016 Lord & Taylor settlement facts.
The same disclosure standard covers the influencer arrangements behind many native placements, which is the subject of our influencer disclosure data. A conspicuous, plain-language disclaimer, like the one you can generate for your own sponsored content, is the fastest way to stay on the compliant side of that test.
How current is the native ad spend data?
Warning
The $98.6 billion figure and the 59% display-spend share are 2023 numbers, the most recent breakout eMarketer has published publicly as of this writing. We could not locate a fresher official US native ad spend total broken out by format for 2024 or 2025. Total digital ad spend has kept growing since 2023, so treat the dollar figure as a floor rather than a current snapshot, and treat the underlying share as more durable than the exact dollar amount.
Native advertising has kept expanding into new surfaces since 2023, including AI-generated shopping recommendations and in-app native units inside retail media networks, but we could not find a published, sourced dollar figure for how much of current spend those newer formats represent. That is a real gap in the public data, not a rounding error, and it is worth checking eMarketer’s newest forecast directly before citing the $98.6 billion figure as this year’s total.
Figure 6: Key native advertising spend and disclosure milestones. Sources: FTC guidance history, eMarketer forecast data.
Native advertising performance at a glance
| Metric | Value | Year | Source |
|---|---|---|---|
| US native ad spend, share of display | $98.6 billion, 59%+ of display | 2023 | eMarketer |
| Native share of video ad spend | 84.1% | 2022 | eMarketer / Outbrain |
| Attention lift vs. display ads | +53% more looked at | 2021-2022 | Outbrain |
| CPC drop for 6+ month campaigns | -36.4% | 2021-2022 | Outbrain |
Source: eMarketer US Native Advertising Forecast; Outbrain native advertising benchmark data.
The Bottom Line
Native advertising is no longer a niche format sitting beside a publisher’s banner inventory. It is the majority of US digital display spend, at $98.6 billion and more than 59% of the category in 2023, and it keeps outperforming plain display ads on attention and purchase intent. That success is exactly why the FTC treats disclosure as non-negotiable: Lord & Taylor’s undisclosed influencer campaign reached 11.4 million people before regulators stepped in, and the same clear-and-conspicuous standard applies to every sponsored article, promoted listing, and paid post published today. A plain-language disclaimer attached to every native placement is a small cost against a spend category this large, and it is the difference between a compliant campaign and a federal settlement.
Frequently Asked Questions
What percentage of US digital ad spend is native advertising? US native advertising spending reached $98.6 billion in 2023, more than 59% of all US digital display ad spend, according to eMarketer, and it grew 37% from 2021 to that point.
Do native ads have to be disclosed under FTC rules? Yes. The FTC requires that a native ad or sponsored post be clearly and conspicuously labeled as advertising, in a format and position readers will actually notice, so it is not mistaken for independent editorial content.
Are native ads more effective than banner or display ads? Outbrain’s campaign data shows consumers look at native ads 53% more than display ads and that native placements produce an 18% increase in purchase intent, though these are vendor-reported figures rather than an independent audit.
What happened in the FTC’s case against Lord & Taylor? In 2016 the FTC settled charges that Lord & Taylor paid 50 fashion influencers between $1,000 and $4,000 each to post about the same dress, and paid for a Nylon magazine article, without disclosing the payments. The Instagram campaign alone reached 11.4 million users and generated 328,000 engagements.
Sources and References
- Outbrain. (Updated 2022). “Top Native Advertising Statistics.” Compiles eMarketer US native ad spend forecasts plus Outbrain’s own campaign, affiliate, and Savanta survey data.
- Wikipedia. “Native advertising.” Cites eMarketer’s US Native Advertising Forecast for the $98.6 billion, 2023, 59%+ of display spend figure.
- CNBC. Gustafson, Krystina. (2016). “Lord & Taylor settles deceptive advertising charges.” Reports the FTC complaint details: 50 influencers, $1,000 to $4,000 payments, 11.4 million Instagram reach, 328,000 engagements.
- Wikipedia. “Lord & Taylor.” Summarizes the FTC settlement terms barring misrepresentation of paid content as independent editorial.
- Federal Trade Commission. “Native Advertising: A Guide for Businesses.” Official disclosure standard requiring clear and conspicuous labeling of paid native content.
Note: All figures verified as of September 2026. The $98.6 billion spend figure and the 84.1% native video share are the most recent publicly available breakouts we could locate; both are refreshed here at least twice a year as newer forecasts are published.
![$68.6B: Amazon Advertising 2026 [Spend Data]](/_astro/amazon-advertising-2026.DFxB0rDi_1ebTR.webp)


![Amazon Affiliate Rate Falls to 10% in 2026 [Full List]](/_astro/commission-programs-2026.DvBRm6Oc_Z44gbJ.webp)