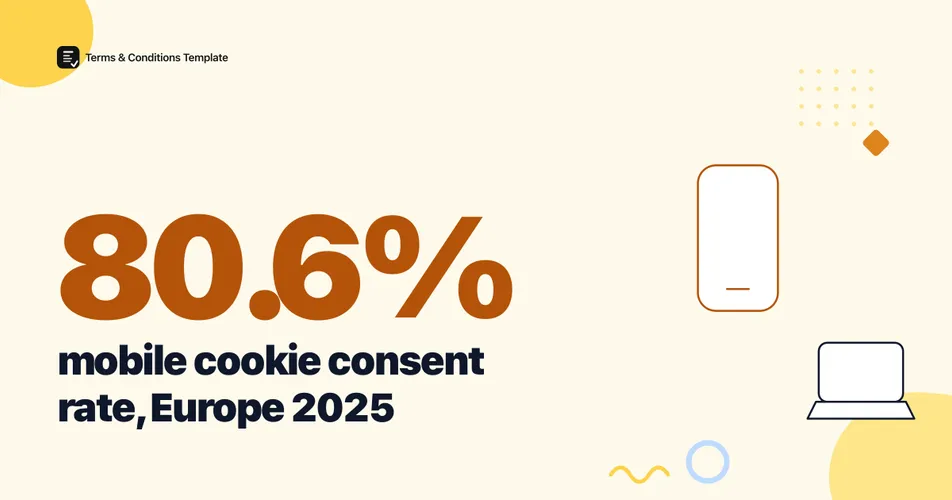
Mobile visitors accept cookie banners at an 80.6% rate, 2.8 percentage points higher than the 77.8% desktop consent rate, according to Didomi’s 2026 State of Data Privacy Benchmark, which measured European consent interactions throughout 2025. Tablet trails close behind desktop at 77.4%, and connected TV lags furthest behind at 75.9%. The gap is small in absolute terms, but it holds across a benchmark large enough to matter for anyone deciding which device experience to optimize first.
Do mobile users accept cookies more often than desktop users?
Yes, and the gap is consistent enough that Didomi calls it out as its own benchmark category. Mobile visitors clicked accept, or resolved consent in a way the site counts as valid, at an 80.6% rate across European sites in 2025. Desktop visitors did the same at 77.8%, a 2.8 percentage point gap that held up across “a wide range of websites, audiences, and implementations,” per the benchmark’s own framing.
Figure 1: Cookie consent (accept) rate by device type across European websites, 2025 data. Source: Didomi, 2026 State of Data Privacy Benchmark.
Mobile is the only device that clears 80%. Every other device sits within three points of each other, which suggests the real divide in this data is mobile versus everything else, not a smooth ranking from best to worst.
Desktop and tablet both trail mobile by roughly the same margin, and connected TV, covered in more detail below, trails furthest of all. If your site’s cookie banner already looks different on a phone than on a laptop, this is one of the reasons that difference tends to pay off.
Why would mobile cookie consent rates beat desktop?
Didomi’s benchmark does not publish a stated cause for the gap. It does flag “banner usability and button sizing” as the most common friction points across formats generally, which lines up with a plausible mechanical explanation: mobile screens force a simpler, single-layer banner with large tap targets, while desktop’s extra screen room tends to invite more text, more options, and more scrolling before a visitor reaches a button at all. That is an inference from the pattern in the data, not a claim Didomi makes directly, so treat it as informed reasoning rather than a sourced fact.
What is measurable is what happens after the first layer. On average, just 5.4% of visitors click through to a banner’s second-layer settings screen rather than resolving consent on the first screen. That rate is higher on the devices with the most friction: 6.8% on mobile and 9.4% on connected TV, against a European average of 5.4%.
Figure 2: How often visitors resolve cookie consent on the first banner layer versus digging into settings, and how that varies by device. Source: Didomi, 2026 State of Data Privacy Benchmark; the 94.6% first-layer figure is the arithmetic complement of the published 5.4% average.
A cookie policy generator that keeps language short and specific helps here regardless of device, since the underlying policy still has to back up whatever the banner promises, especially for the smaller share of visitors who do dig into the settings screen.
How does connected TV consent compare to mobile and desktop?
Connected TV is the clear outlier in this dataset. Its overall consent rate of 75.9% is the lowest of any device Didomi tracks, and the reason becomes clearer once you break the outcome into its three possible paths: opt in, actively reject, or make no choice at all. On CTV, 41.1% of viewers make no choice, nearly the same share that opts in.
Figure 3: Outcome breakdown for connected TV cookie banners, European data, 2025. Reject share (13.0%) is the implied remainder after opt-in and no-choice are subtracted from 100%. Source: Didomi, 2026 State of Data Privacy Benchmark.
That 41.1% no-choice rate is more than triple the roughly 12-15% no-choice range Didomi reports for the web overall across European regions. A remote control is a worse tool for reading a privacy notice than a touchscreen or a mouse, and the outcome data reflects that plainly.
Interestingly, Didomi’s SDK-level CTV data, measured through the app itself rather than a web banner, tells a different story: a 14.2% no-choice rate paired with a 66.4% opt-in rate, both stronger than the web-based CTV numbers above. That gap between in-app and web-rendered CTV banners is worth noting if your product reaches connected TV through more than one integration path.
Which cookie banner format gets the highest consent rate?
Format matters more than device for some sites, and the most common format is not the best-performing one. Header-style banners convert at 80%, the highest of any layout Didomi tracks, but they appear on just 0.4% of sites. Pop-ups, the format used on 78.5% of sites, convert at only 69.9%, roughly ten points lower.
| Banner format | Consent rate | Share of sites using it |
|---|---|---|
| Header | 80.0% | 0.4% |
| Full-screen | 77.2% | 1.4% |
| Pop-up | 69.9% | 78.5% |
| Footer | 69.7% | 19.8% |
Source: Didomi, 2026 State of Data Privacy Benchmark, European sites, 2025 data.
Figure 4: Cookie banner formats plotted by how common each one is versus how well it converts. Positions are scaled to the observed range of the four formats, not raw mermaid units. Source: author analysis of Didomi’s 2026 State of Data Privacy Benchmark.
The two formats that convert best, header and full-screen, are also the two formats almost nobody uses. Didomi’s own framing is a fair caution here: consent rate is shaped by more than format alone, including industry, audience, and regulatory context, so this is a starting point for a design test, not a mandate to switch every site to a header banner overnight.
Does cookie consent vary by industry as much as by device?
More, in fact. Across the 16 industries Didomi tracks in Europe, consent rates span from 82.7% for Media and Publishers down to 69.6% for Energy and Utilities, a 13.1 percentage point range, roughly five times wider than the 2.8 point gap between mobile and desktop.
Figure 5: Cookie consent rate for six of the 16 industries in Didomi’s benchmark, highest and lowest ranked. Source: Didomi, 2026 State of Data Privacy Benchmark, European sites, 2025 data.
Industry sits alongside device and banner format as one of the bigger levers in this dataset. For the fuller picture of how enforcement and industry risk interact, including where regulators have actually issued fines, see our breakdown of cookie compliance by industry. A dedicated look at cookie banner design choices by device is a natural next step for this cluster; we do not yet have a published breakdown of that specific angle, so we are not linking to one here rather than pointing at a page that does not exist yet.
Cookie consent rates by device: the full picture
The table below pulls together every device-level figure from Didomi’s 2026 benchmark. Opt-in and no-choice rates are only disclosed for connected TV in the source article; Didomi does not break those two metrics out separately for mobile, desktop, or tablet in the material we reviewed.
| Device | Consent rate | Opt-in rate | No-choice rate |
|---|---|---|---|
| Mobile | 80.6% | Not disclosed | Not disclosed |
| Desktop | 77.8% | Not disclosed | Not disclosed |
| Tablet | 77.4% | Not disclosed | Not disclosed |
| Connected TV (web) | 75.9% | 45.9% | 41.1% |
| Connected TV (in-app SDK) | Not disclosed | 66.4% | 14.2% |
Source: Didomi, 2026 State of Data Privacy Benchmark, European sites, 2025 data.
For context outside Europe, Didomi’s separate United States breakdown reports a much higher 94.2% national acceptance rate for 2025, ranging from 99.2% in Iowa to 90.6% in Wyoming. That figure is measured against a different baseline and regulatory environment (state-level US privacy laws rather than the EU’s GDPR), so it should not be read as a device comparison or averaged together with the European numbers above; we mention it here only to flag that region, not device, is still the biggest single driver of consent-rate differences in this data.
The Bottom Line
Mobile beats desktop on cookie consent by 2.8 percentage points, 80.6% versus 77.8%, and connected TV trails both at 75.9% with the highest no-choice rate of any device Didomi measures. That gap is real but modest next to the swings tied to banner format (a 10-point spread between header and pop-up layouts) and industry (a 13-point spread from Media and Publishers down to Energy and Utilities). If you are optimizing a cookie banner and can only fix one thing, format and industry-specific copy will likely move the number further than a device-only redesign, though mobile still deserves the simplest, largest-tap-target version of whatever banner you ship.
Frequently Asked Questions
Do mobile users accept cookies more often than desktop users? Yes. Mobile visitors accept cookie banners at an 80.6% rate compared with 77.8% on desktop, a 2.8 percentage point gap, according to Didomi’s 2026 State of Data Privacy Benchmark of European sites measured throughout 2025.
Which device has the lowest cookie consent rate? Connected TV, at 75.9% in the 2025 European data, with 41.1% of viewers making no choice at all and only 45.9% actively opting in, the highest no-choice rate of any device Didomi tracks.
What is the average cookie consent rate in the United States? 94.2% nationally in 2025, according to Didomi, ranging from 99.2% in Iowa to 90.6% in Wyoming. That figure is measured differently than the European device breakdown, so the two should not be compared directly.
Which cookie banner format gets the highest consent rate? Header-style banners convert best at 80%, though they run on only 0.4% of sites. Pop-ups, used on 78.5% of sites, convert at just 69.9% (Didomi, 2026).
Sources and References
- Didomi. (2026). “Does Consent Banner Performance Vary by Device in 2026?” Consent rate by mobile, desktop, tablet, and connected TV, European sites, 2025 data.
- Didomi. (2026). “What Is the Average Consent Rate in Europe in 2026?” Regional opt-in and no-choice rate breakdowns.
- Didomi. (2026). “Which Industry Has the Highest Consent Rate in Europe in 2026?” Consent rate across 16 European industries, 2025 data.
- Didomi. (2026). “What Is the Best Consent Banner Format in Europe in 2026?” Consent rate and adoption share by banner format.
- Didomi. (2026). “What Is the Average Acceptance Rate in the United States in 2026?” State-by-state US consent acceptance data, 2025.
- Didomi. (2026). “Didomi Publishes Its 2026 Benchmark on Consent Collection, Banners, and Industry Trends.” Underlying report methodology: consent solutions implemented across thousands of websites and apps in Europe and North America, data collected throughout 2025.
Note: All figures verified as of September 2026. Didomi does not disclose an exact site or event count for the device-level breakdown specifically, only that its wider 2026 State of Data Privacy Benchmark draws on consent solutions across thousands of websites and apps; treat the device gap as directionally reliable rather than a precise population statistic. Consent behavior shifts with banner redesigns and regulatory changes, so headline figures here are refreshed at least twice a year.